
Introduction
Heroku is a cloud-based platform to deploy, manage, and scale your node applications. It supports a wide range of languages including Node, Ruby, Python, Java, PHP, etc. along with providing a container-based load balancing approach.
In this article, we will be covering how to monitor a Node.js application using Heroku CLI and visualize the metrics using the HG Heroku monitoring add-on.
The HG Heroku monitoring tool is an infrastructure and application monitoring tool that imports metrics from any data source, and visualizes the metrics on a single pane of glass. When you login to your HG Heroku Monitoring tool, dashboards for your Heroku app will be built automatically. Check it out here:
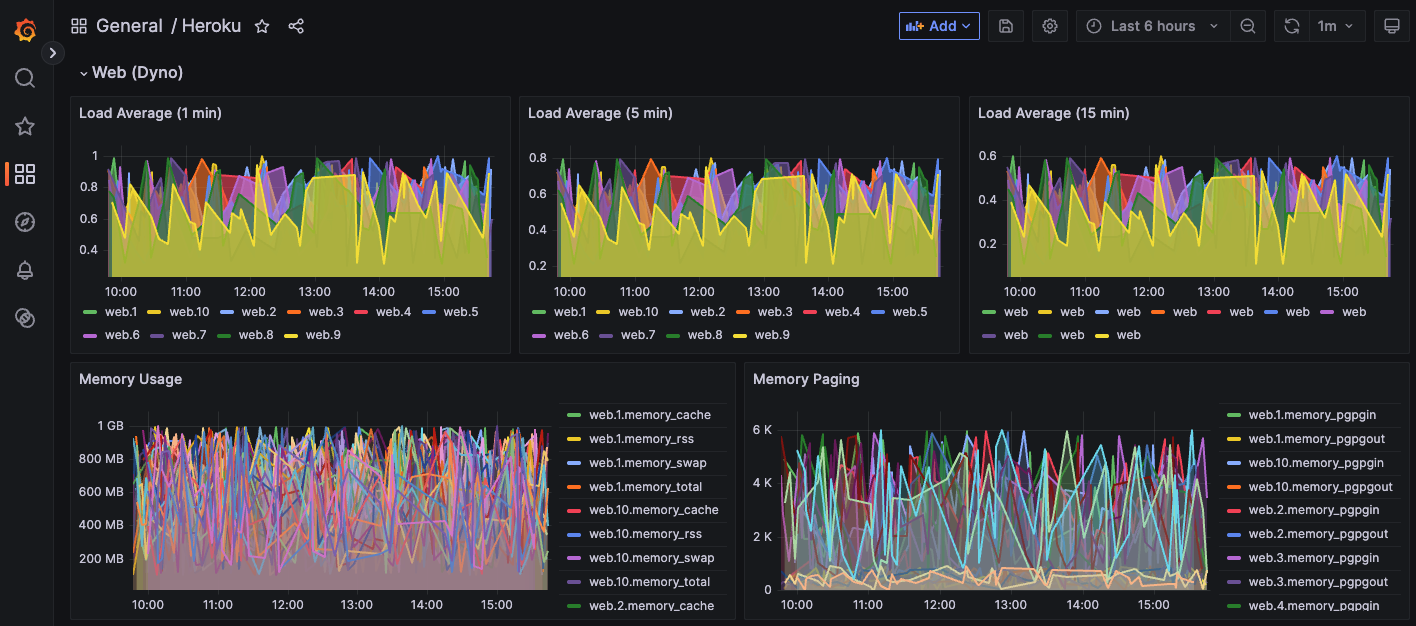
The service also provides full support, and you can easily access it in the intercom chat window in your app. If you’re just starting your journey with Heroku, an introductory read on Heroku Monitoring with Hosted Graphite is recommended.
Setting up your environment

This guide focuses on monitoring a Node.js application that has already been deployed to Heroku. It does not cover building or deploying the Node.js application itself. So before continuing, you'll need:
- A Node application running on Heroku
- The Heroku CLI installed and authenticated
- Git installed locally if you plan to make and deploy application changes from your local environment
If you don't yet have a Node.js application deployed to Heroku, follow Heroku's Getting Started with Node.js guide first. Once your application is running, return here to configure monitoring with Hosted Graphite.
Monitoring your Heroku app using the Hosted Graphite Add-on
1. Connect Heroku with HG Heroku add-on using Heroku CLI
Copy the following command to your terminal.
$ heroku addons:create hostedgraphite -a <app-name>
To check whether our add-on is working properly, navigate to your Heroku UI => Resources tab => node.js application. You should see something like this:
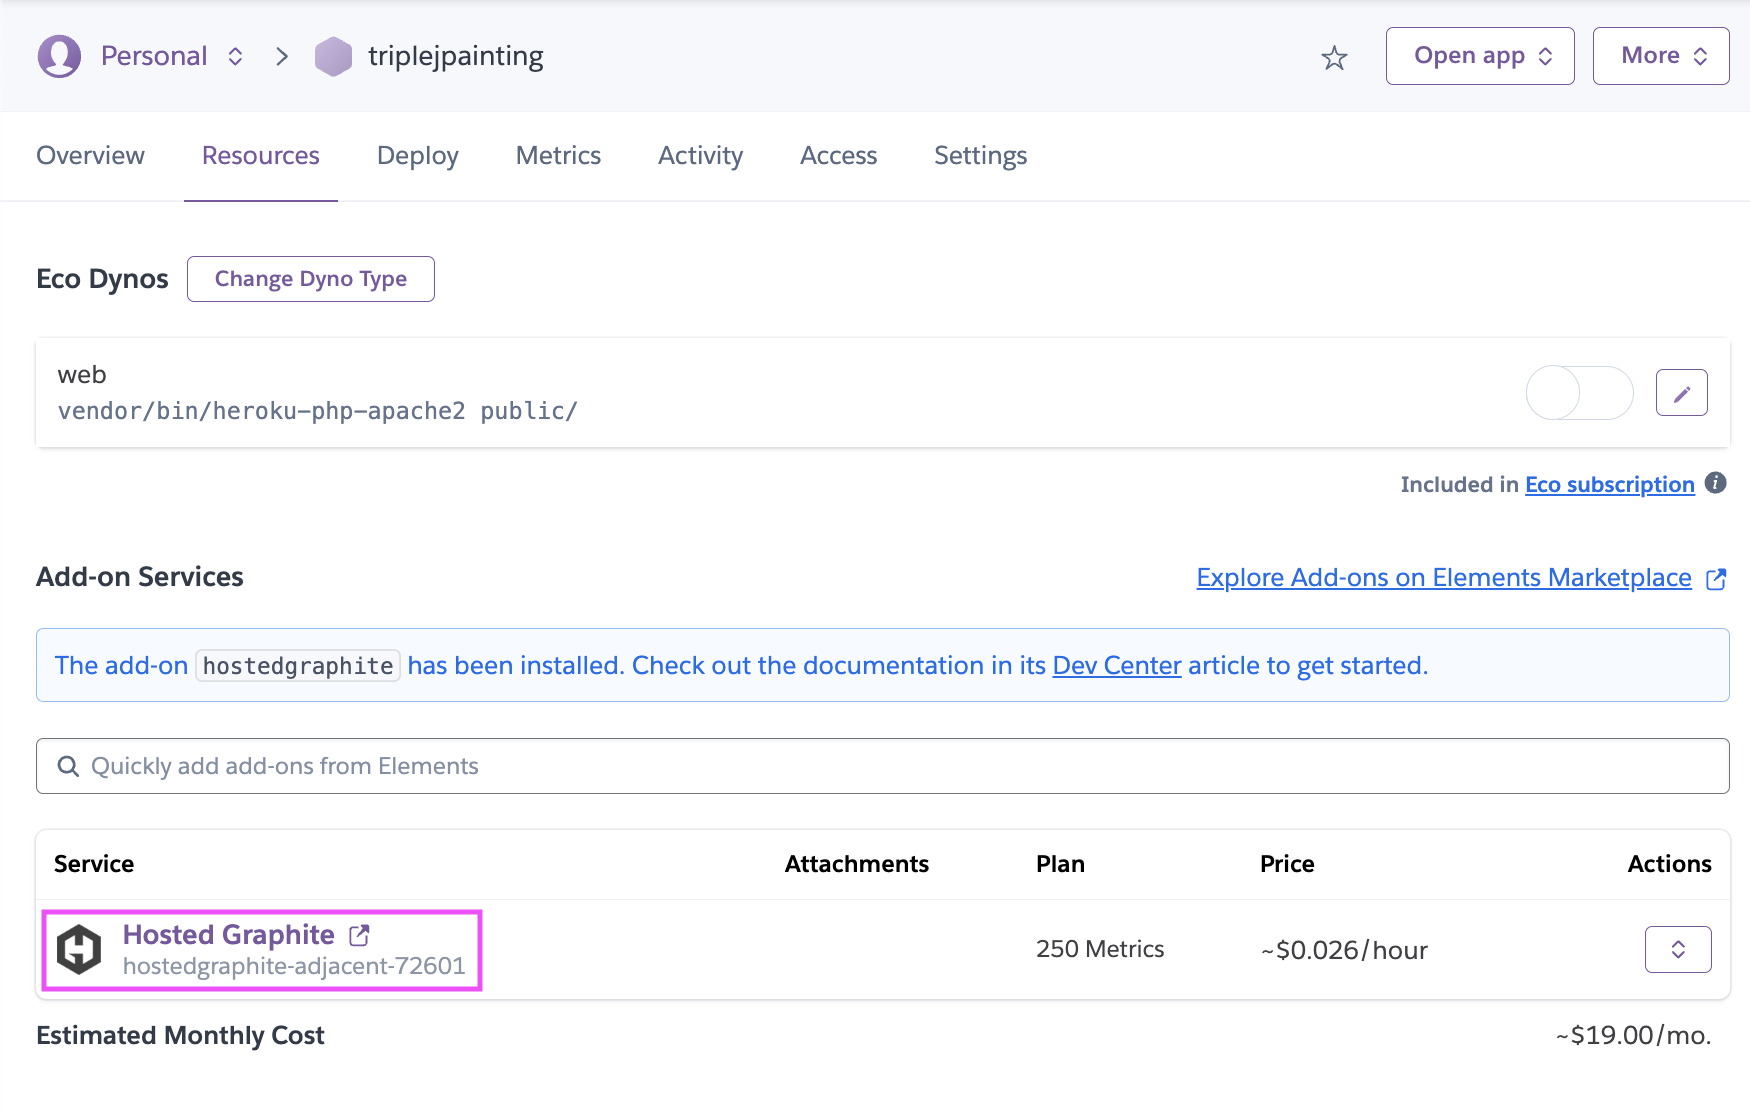
You will be directed to your HG Heroku Monitoring account by clicking on this add-on in your Heroku account, where you can obtain your API key. Go to the HG Metrics Search UI and you will see all of the Heroku metrics that have been ingested:
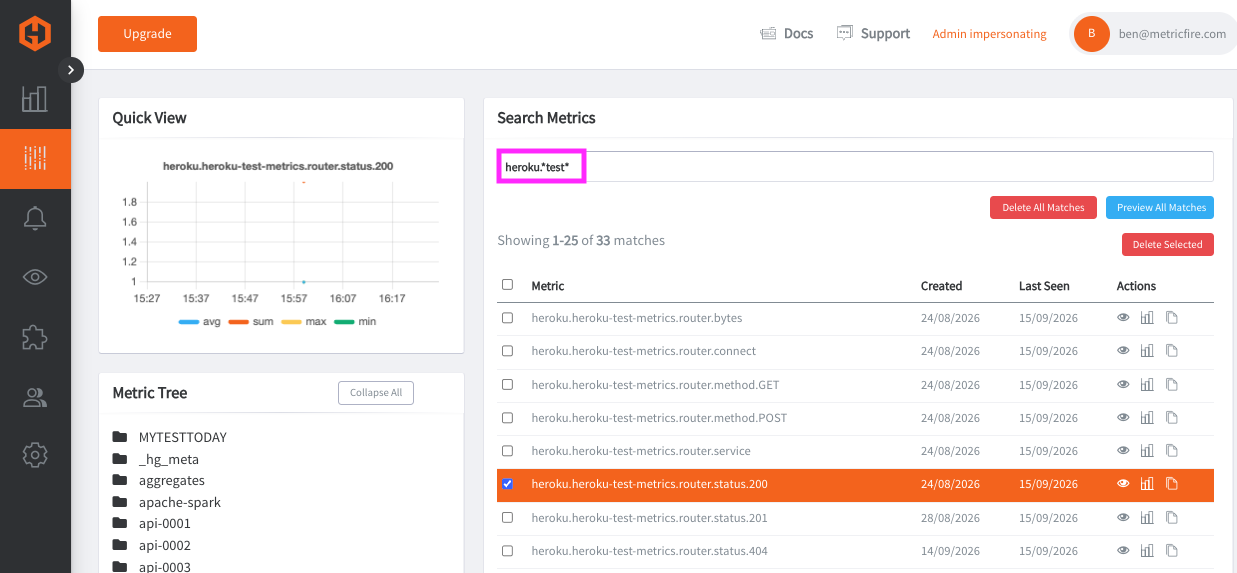
2. Enabling Node.js Runtime Metrics
Heroku can expose language-specific runtime metrics for Node applications, providing additional visibility into application performance alongside standard Heroku metrics and any custom metrics your application sends.
For current instructions on enabling these metrics, refer to Heroku's Node.js Language Runtime Metrics documentation. Once enabled, the metrics are included in your application's Heroku log stream, where the Hosted Graphite add-on can process and forward them to your account. If metrics don't show up, try restarting Heroku using:
$heroku restart
3. Metrics on Grafana Dashboards
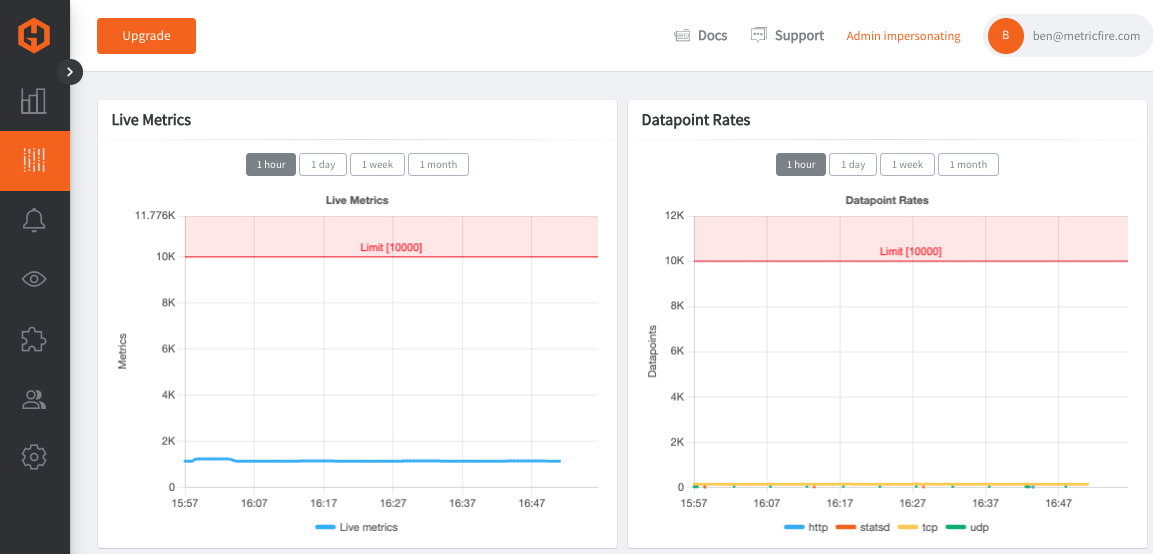
To verify if the metrics are indeed sending their data to our dashboard, go to Metrics => Account Diagnostics. If metrics are being ingested in the HG backend, traffic will be reproted here:
Conclusion
In this tutorial, we saw how to use the HG Heroku monitoring service to your Heroku Node.js Application using Heroku CLI. We also covered enabling traffic Metrics and visualizing the information using Grafana Dashboard.
The HG Heroku monitoring service is run by MetricFire, a hosted Prometheus, Graphite and Grafana service. Hosted Prometheus, Hosted Graphite and Hosted Grafana can do much more than Heroku Metrics Visualization. To find out more, book a free trial today! or check out our post on 10 reasons why you should choose MetricFire.


.png)

.svg)