
Server Monitoring on Heroku
Heroku server monitoring can be a big challenge as the default metrics available in the Heroku UI aren’t usually enough to get you meaningful visibility into your system. You need to watch the performance of your application, dynos, add-ons, processes, overarching infrastructure, and even some tools such as CircleCI.
It’s a good idea to do your Heroku server monitoring with a tool that can also ingest metrics from your entire infrastructure. To accomplish this and have a robust full-stack monitoring setup, you can install the Heroku Hosted Graphite addon onto your Heroku app(s). Not only does this pull statistics from your Heroku app logs, but you can pull in custom metrics from every other part of your infrastructure, and see everything on a single pane of glass.
Hosted Graphite monitoring is built on the open source Graphite, Grafana, and StatsD, so you can customize and adjust it to your needs easily. With the Heroku Hosted Graphite Add-on, not only can you monitor Heroku apps, you can also pull in metrics from AWS, Azure, GCP, DigitalOcean, self-hosted servers, and much more. You can see everything that’s important to you in one place, regardless of if it’s a Heroku metric or not.
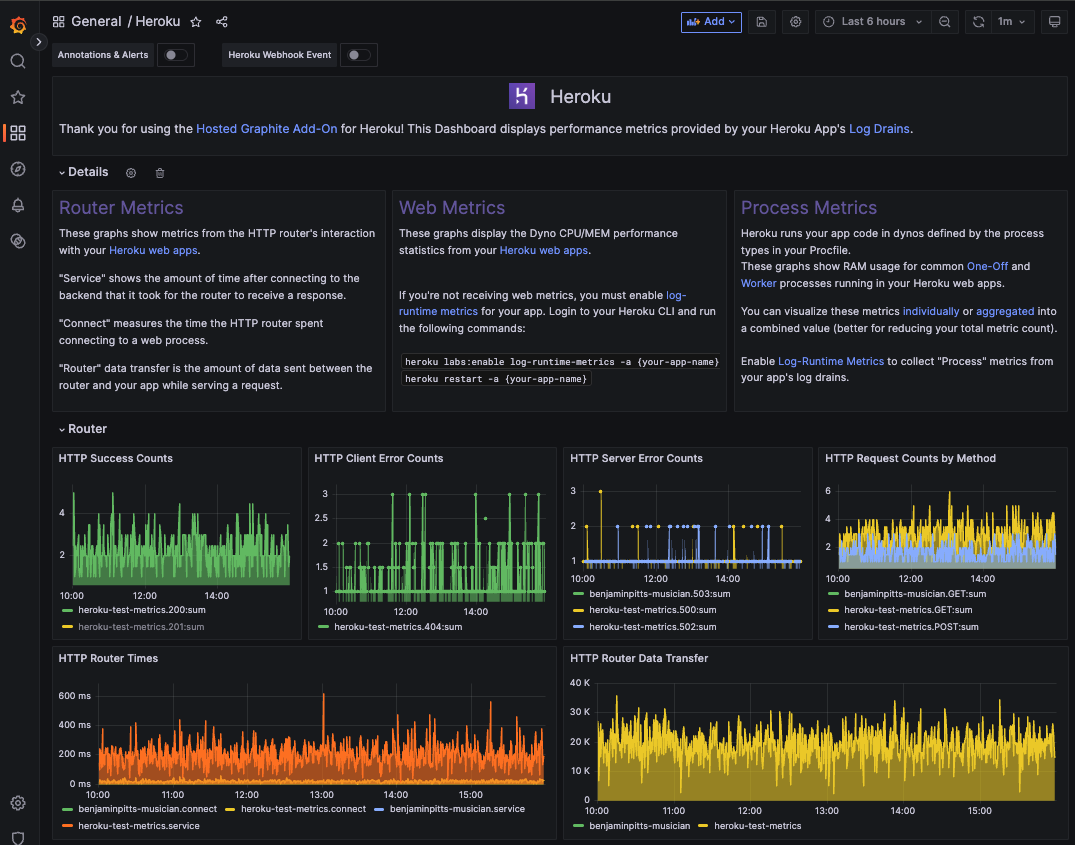
The Heroku Hosted Graphite monitoring add-on also creates default Heroku dashboards for you, that are visible immediately when you get into the app. Check it out:
What is Hosted Graphite?
Hosted Graphite by MetricFire has improved upon standard Graphite and offers additional tools and features that provide our customers with a robust and well-rounded monitoring solution.
- We handle the aggregation, storage, and backups of your data. We have built-in features like Data Views and Aggregation Rules, and offer a list of API's for programatic management of your monitoring environment.
- Send server metrics from your running instances, custom metrics from within your application code, and integration metrics from other popular services that we integrate with, like Heroku, AWS, Azure, and GCP.
- Visualize your data in meaningful ways with customizable dashboards that look awesome!
- Configure alerts to your metrics and integrate with popular notification channels such as Email, Slack, Pager Duty, Microsoft Teams, OpsGenie, or custom Webhooks.
- We have fast and friendly support and are dedicated to making sure you get the highest possible value from our services.
Graphite and Heroku in Action
On Heroku, you can install the Hosted Graphite addon from within the Heroku UI or CLI. The integration process is straightforward and simple. Once you finish adding Graphite, your app logs are automatically forwarded to the Hosted Graphite webhooks endpoint, where they are converted to the Graphite format, stored in Hosted Graphite backend, and can be used to create custom dashboards and alerts.
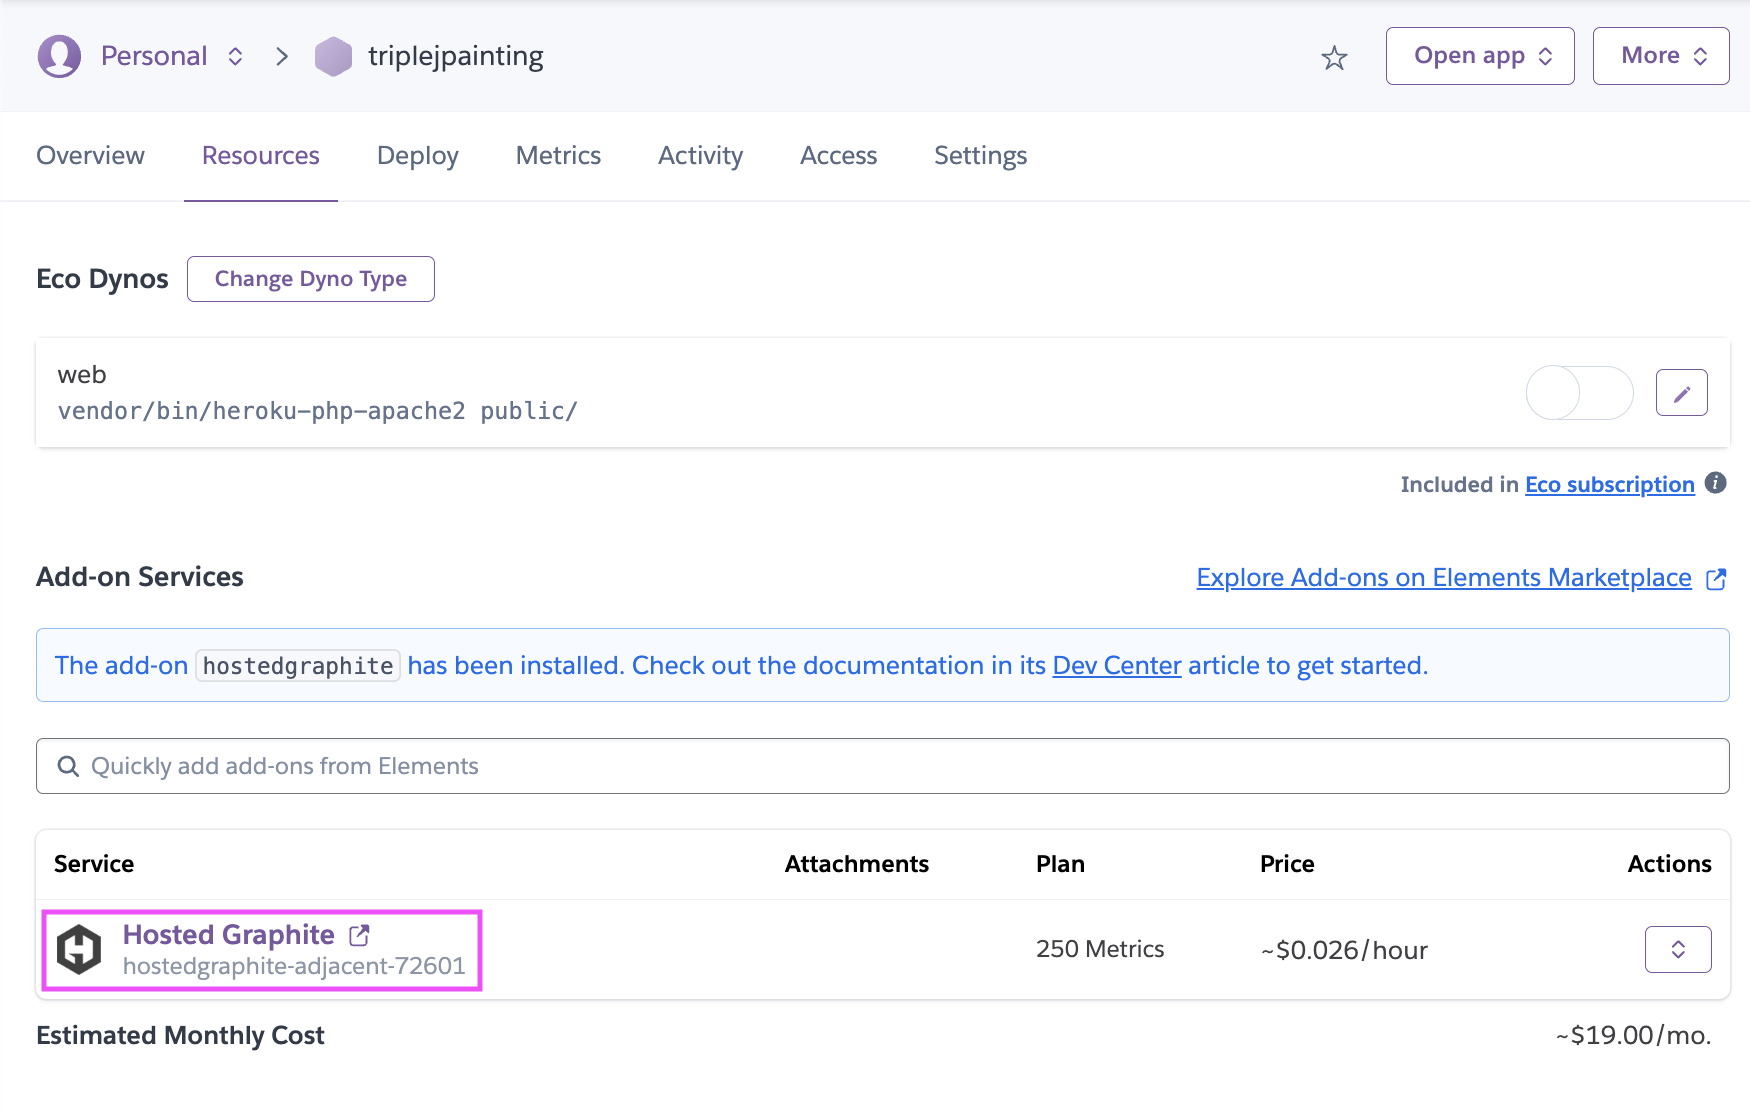
Within Hosted Graphite, you can add many more apps to boost monitoring capabilities. If you look at the right bottom corner of your HG account, you can contact the Hosted Graphite team using the chat feature and get your questions answered. Our average response time is just 5 minutes!
Easy Heroku Server Monitoring with Great Dashboards
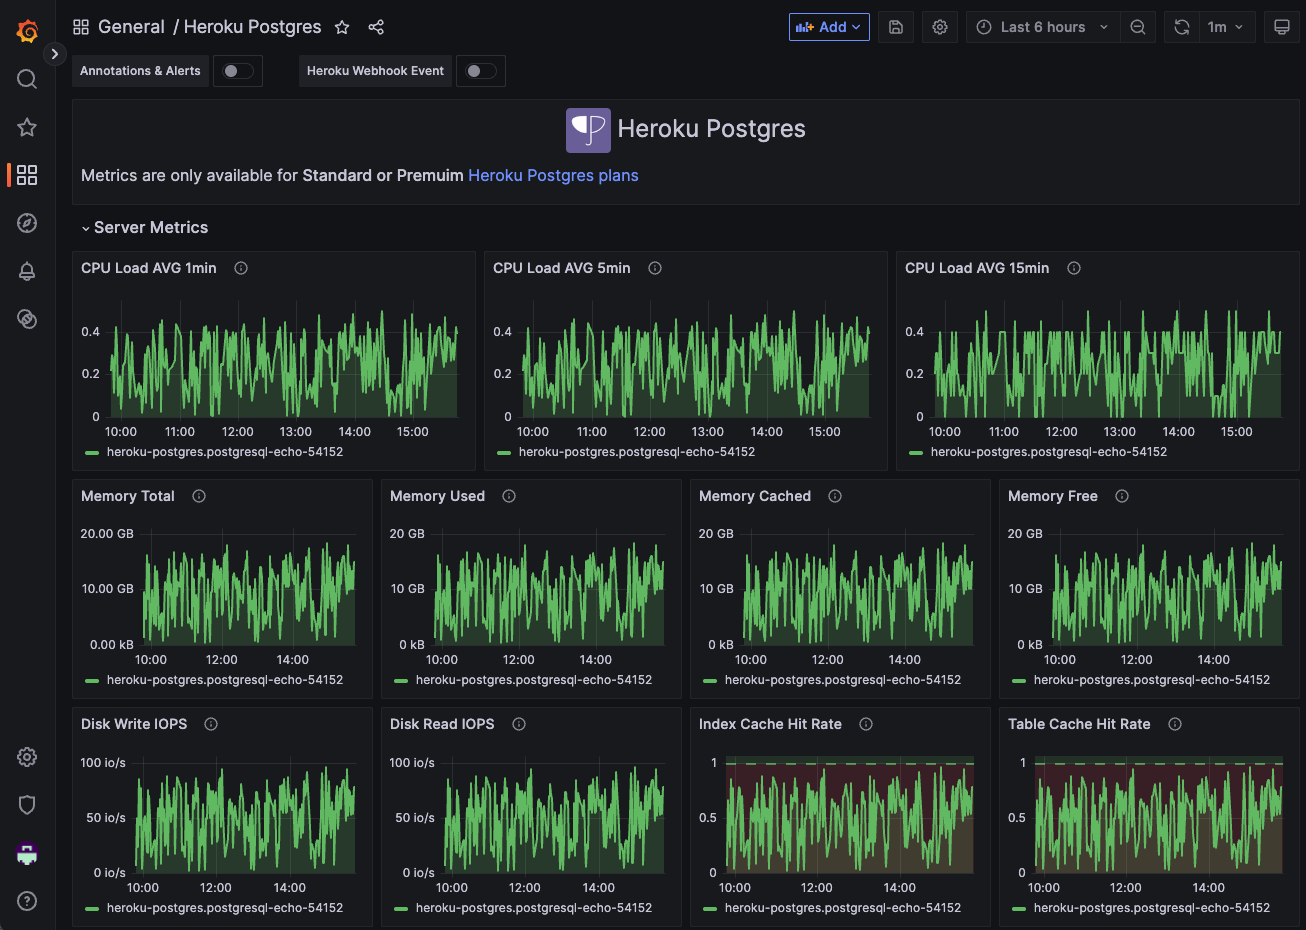
With Hosted Graphite monitoring, you can have beautiful dashboards that shows various metrics around the performance of your Heroku apps. You can build unlimited custom graphs and charts to see meaningful insights. Since you can add various stats on a single page, you don’t have to navigate through different tabs or menus to find information you want. Hosted Graphite also pulls stats from your Heroku Postgres, Redis, and Kafka instances, as well as Process metrics (scheduler, worker, release, run), and Herokuconnect stats (sync duration, operations).
Alerting Control
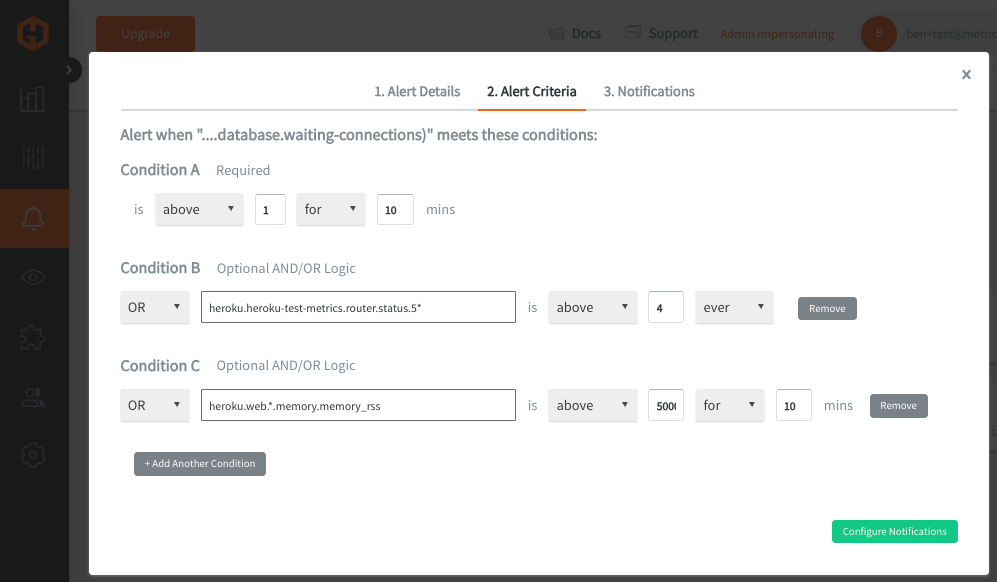
Hosted Graphite alerts allow you to combine multiple conditions into a single alert using AND / OR logic, and up to four conditions can be configured. This helps reduce alert fatigue by correlating multiple metric evaluations before triggering a notification. So instead of alerting on one noisy metric in isolation, our composite alerts allow you to build higher-confidence alerts around overall service health.
Final thoughts
The Heroku Hosted Graphite monitoring add-on provides convenient features to customize how your Heroku metrics are stored and aggregated. Hosted Graphite also provides hosted services and expertise to major global companies such as Salesforce, Accenture, Nielsen, and many more.
With a hosted Graphite solution, you can maximize your monitoring efficiency and minimize maintenance burdens. You can use the product with simple configuration to gain in-depth insight into your infrastructure. If you would like to learn more about it, get on to our listing and install the addon!


.png)

.svg)