
Introduction
Redis is commonly used in Heroku apps for caching, queues, sessions, and anywhere else you need fast access to data. Heroku’s managed Redis service, now called Heroku Key-Value Store, handles most of the setup for you. But once your app starts relying on Redis, you’ll probably want to know what it’s actually doing. How much memory is it using? Is the cache still pulling its weight? Are keys getting evicted? Are connections or server load suddenly climbing?
If you’re using the Heroku Hosted Graphite monitoring add-on, this part is pretty easy. Supported Heroku Redis metrics are automatically forwarded into Hosted Graphite, so there’s no need to instrument your app or manually send these metrics yourself.
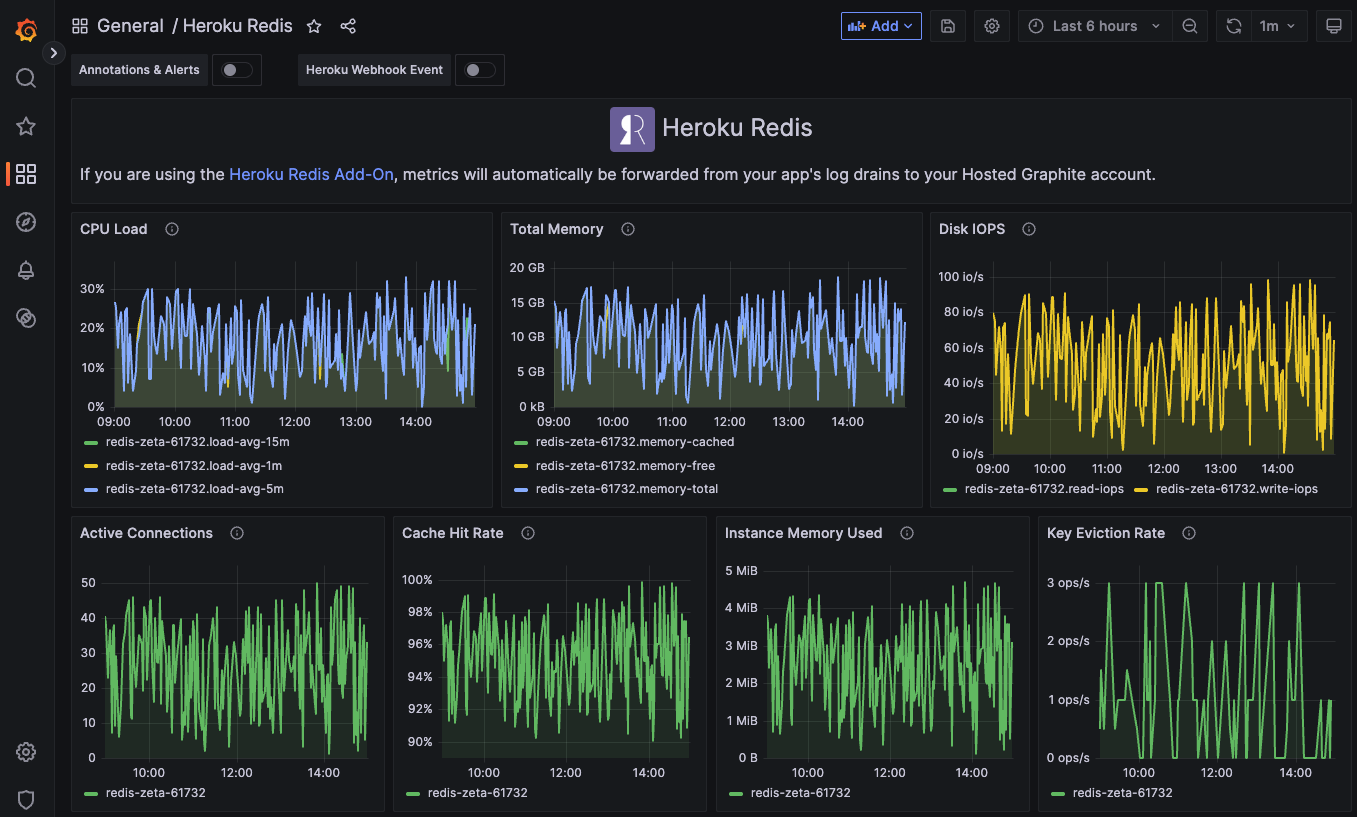
Once the HG add-on is installed on your Heroku app, you can see your Redis metrics in hosted Grafana alongside the rest of your Heroku stack.
Provisioning a Redis Instance
If you already have Redis attached to your Heroku app, you can check with: heroku addons -a <app-name>
To provision a new instance just run: heroku addons:create heroku-redis -a <app-name>
Heroku now calls the product Heroku Key-Value Store, but you’ll still see heroku-redis used in the CLI and metric names. Once the instance is ready, Heroku adds its connection information to your app’s config. You can check for it with: heroku config -a <app-name> | grep REDIS
With Redis up and running, we can get to the more interesting part: monitoring it.
Monitor Heroku Redis with Hosted Graphite
To get started, simply run the following commands from within your Heroku CLI:
- heroku addons:create hostedgraphite -a <app-name>
- heroku addons:open hostedgraphite -a <app-name>
If your app has a Heroku Redis instance attached, supported Redis metrics will automatically start flowing into Hosted Graphite. They follow a naming pattern like:
heroku.<app-name>.heroku-redis.<instance-name>.<type>.<metric>
For example:
heroku.my-app.heroku-redis.redis-zeta-61732.redis.hit-rate
or for a grouped metric query:
heroku.my-app.heroku-redis.*.database.active-connections
There’s nothing else you need to add to your application just to collect these. Once they’re coming in, you can use them to create custom dahsboards and alerts
What Redis Metrics Should I Watch?
There are quite a few Redis metrics available, but you probably don’t need to stare at all of them.
A few are especially useful when you’re trying to figure out whether Redis is healthy or becoming part of a performance problem.
Active Connections
active-connections tracks the number of clients currently connected to Redis. The number itself isn’t necessarily good or bad. I’d pay more attention to how it compares to normal traffic for your app.
If Redis usually has around 20 active connections and suddenly you’re looking at 200 that aren’t going away, that’s worth investigating. Maybe traffic changed, maybe something isn’t closing connections correctly, or maybe you’ve just found a new baseline. Either way, you’ve got somewhere to start looking.
Cache Hit Rate
hit-rate is one of the first metrics I’d look at if you’re using Redis as a cache.
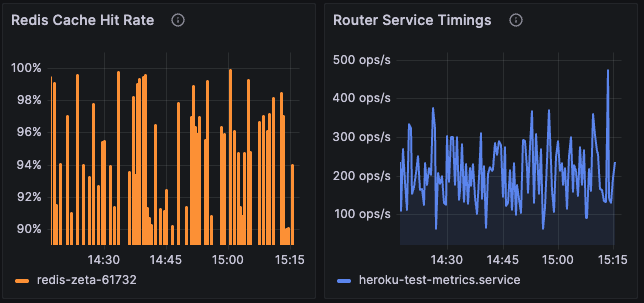
If the cache is doing its job, a good chunk of the data your application asks for should already be there. If hit rate suddenly drops, more requests may be falling through to your database or whatever slower data source sits behind Redis.
That’s also why I wouldn’t look at this metric by itself. If Redis hit rate drops at the same time your application’s response times start climbing, those two things are probably worth investigating together.
Redis Memory and Evicted Keys
These two are another good pair:
memory-redis
evicted-keys
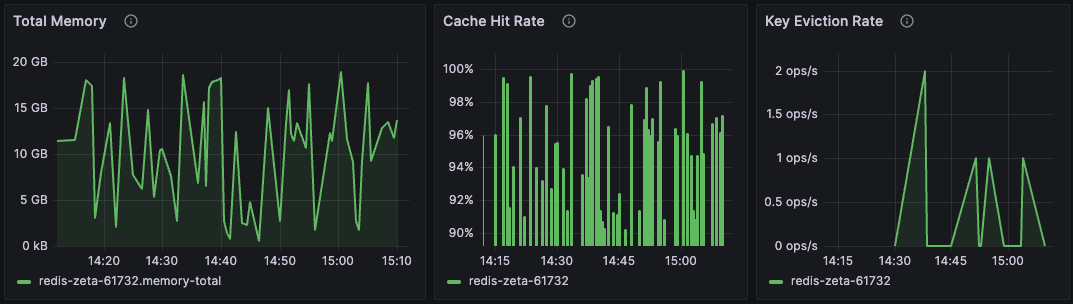
memory-redis tells you how much memory Redis is using, while evicted-keys tells you when Redis has started removing keys to make room for new data. Redis using a lot of memory isn’t automatically a problem because using memory is kind of the whole point.
But if memory keeps climbing and you suddenly start seeing evicted keys, that’s a lot more interesting. Your instance may be running short on room for the amount of data you’re asking it to hold. That’s the kind of situation where I’d want both metrics on the same Grafana panel.
Checking Redis Server Load
Hosted Graphite also receives metrics for the server running your Redis instance:
load-avg-1mload-avg-5mload-avg-15mmemory-cachedmemory-freememory-totalread-iopswrite-iops
The three load averages are useful for separating a quick burst of activity from something that’s been going on for a while.So if load-avg-1m spikes and comes straight back down, there may not be much to worry about. And if the 5 and 15-minute averages start climbing too, the instance has been busy for longer than a quick traffic spike. The IOPS metrics can fill in a little more of the picture. If server load climbs while write-iops shoots up, you’ve got a pretty obvious change in workload to investigate.
You don’t need to treat every metric like a guitar solo. Sometimes it’s the rhythm section telling you the song is falling apart.
Graphing Redis Metrics in Grafana
Once these metrics are in Hosted Graphite, you can build the Redis part of your Grafana dashboard however you want. I’d probably start with:
- cache hit rate
- Redis memory
- evicted keys
- active connections
- server load
- read/write IOPS
You don’t need a giant dashboard with every Redis metric available. A few panels covering those basics will answer most of the first questions you’d ask when Redis starts acting weird. And since these metrics live alongside the rest of your Heroku metrics in Hosted Graphite, you can start connecting the dots between Redis and your application.
Say your Heroku router service time starts climbing. Pull up Redis hit-rate for the same period. If the cache hit rate fell off a cliff at roughly the same time, that’s a pretty good lead. Maybe Redis itself isn’t the problem, but suddenly sending a lot more requests through to your database would definitely be something I’d investigate next.
Alerting on Heroku Redis
Once you know what normal looks like, you can put alerts around the Redis behavior you actually care about.
evicted-keys is an obvious one because when your Redis instance normally isn’t evicting anything and suddenly starts throwing keys out of the cache, I’d probably want to know about it.
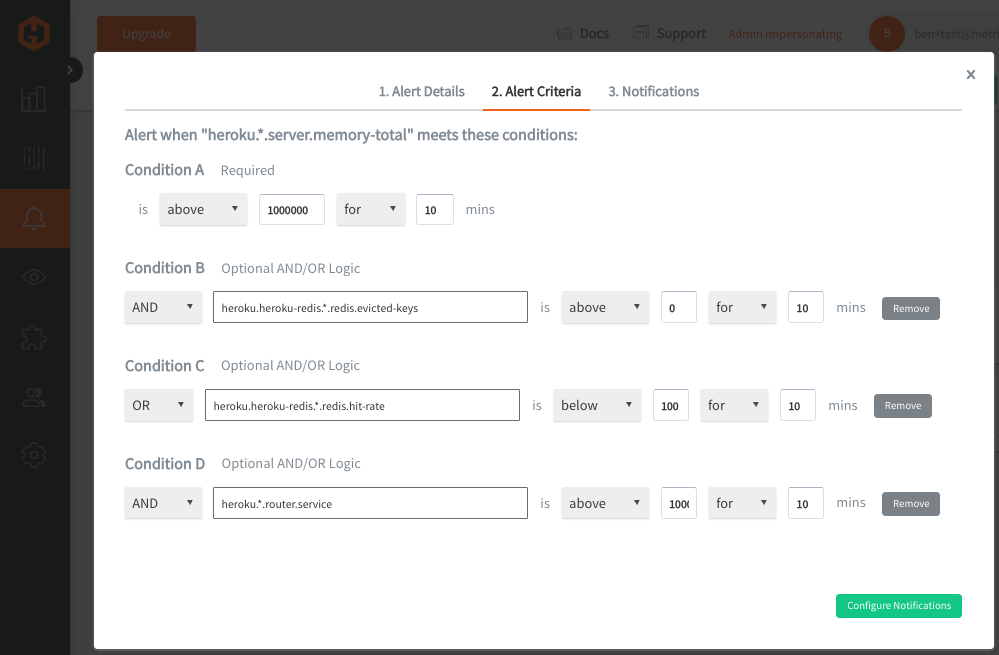
Hosted Graphite Composite Alerting lets you get a little more specific. For example, you can create a service-level alert for:
high memory-redis AND evicted-keys > 0
Now you’re not getting an alert just because Redis happens to be using a lot of memory. You’re getting one because memory is high and Redis has actually started evicting data. You can also combine Redis metrics with the rest of your Heroku metrics:
high memory-redis AND evicted-keys > 0
OR
low Redis hit-rate AND high router service time
That’s a much more interesting situation. Your cache isn’t performing normally, and users are seeing slower requests at the same time. That’s usually the kind of alert I’d rather get: two signals agreeing that something is actually going sideways, instead of getting paged because one graph briefly got excited.
Conclusion
Heroku takes most of the work out of running Redis, and monitoring it with Hosted Graphite doesn’t require much extra setup either. Once Heroku Redis and Hosted Graphite are attached to the same app, supported Redis metrics automatically start flowing into your HG account. From there, you can keep an eye on hit rate, memory, evictions, connections, server load, and I/O in Grafana.
I wouldn’t try to watch every metric at once. Start with the handful that tell you whether Redis is behaving normally, then compare them against the rest of your Heroku stack when something changes. So if the app gets slower, check your cache hit rate. If Redis memory keeps climbing, check for evictions. If server load suddenly jumps, see what happened to traffic and I/O around the same time.
You don’t need every knob turned to 11. You just need enough signal to know where to look when something starts making noise.


.png)

.svg)