
HG Heroku Monitoring tool
The Heroku Hosted Graphite add-on is a great monitoring tool for Heroku application monitoring. Out of all of the Heroku monitoring tools available in the Heroku add-on store, Hosted Graphite is the most flexible and starts at only $19/mo. It's built on the open source Graphite, Grafana, Loki, and StatsD, so it’s easy to import all kinds of metrics from throughout your entire infrastructure. Not only can you work with your Heroku metrics, you can also sync AWS, Azure, GCP, DigitalOcean metrics, and much more.
There are other Heroku monitoring tools available, but none of them are quite as versatile as Hosted Graphite.
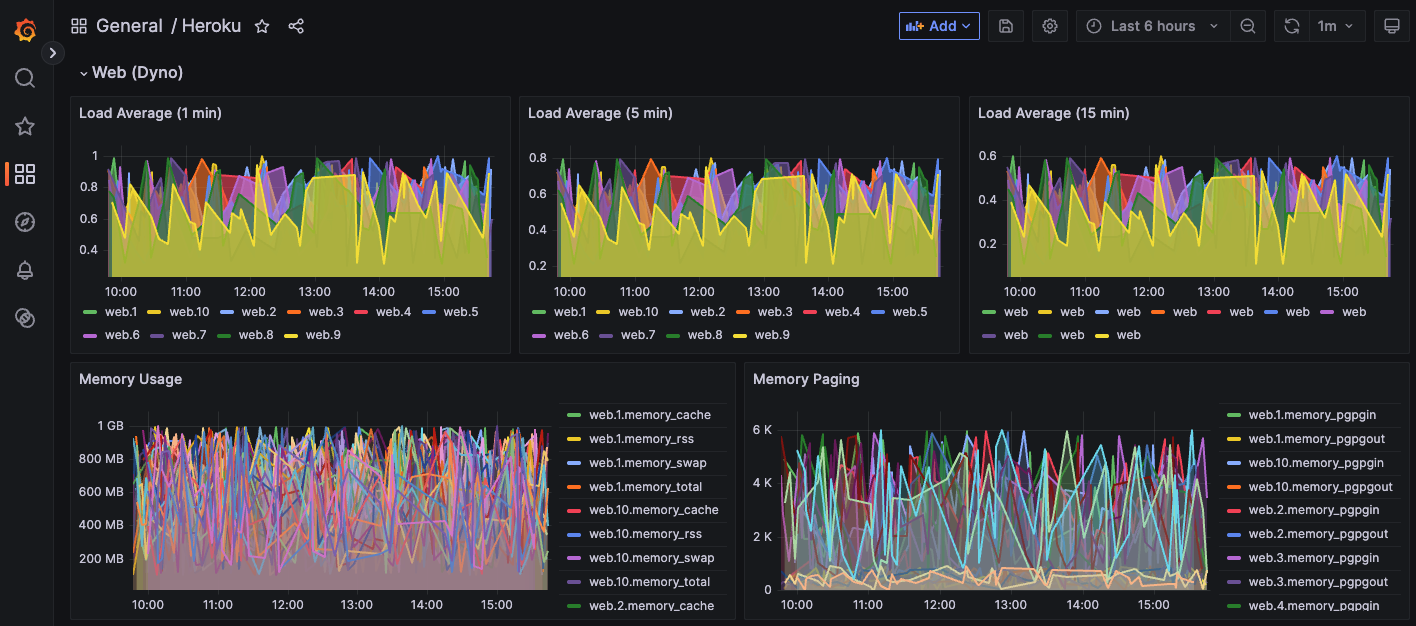
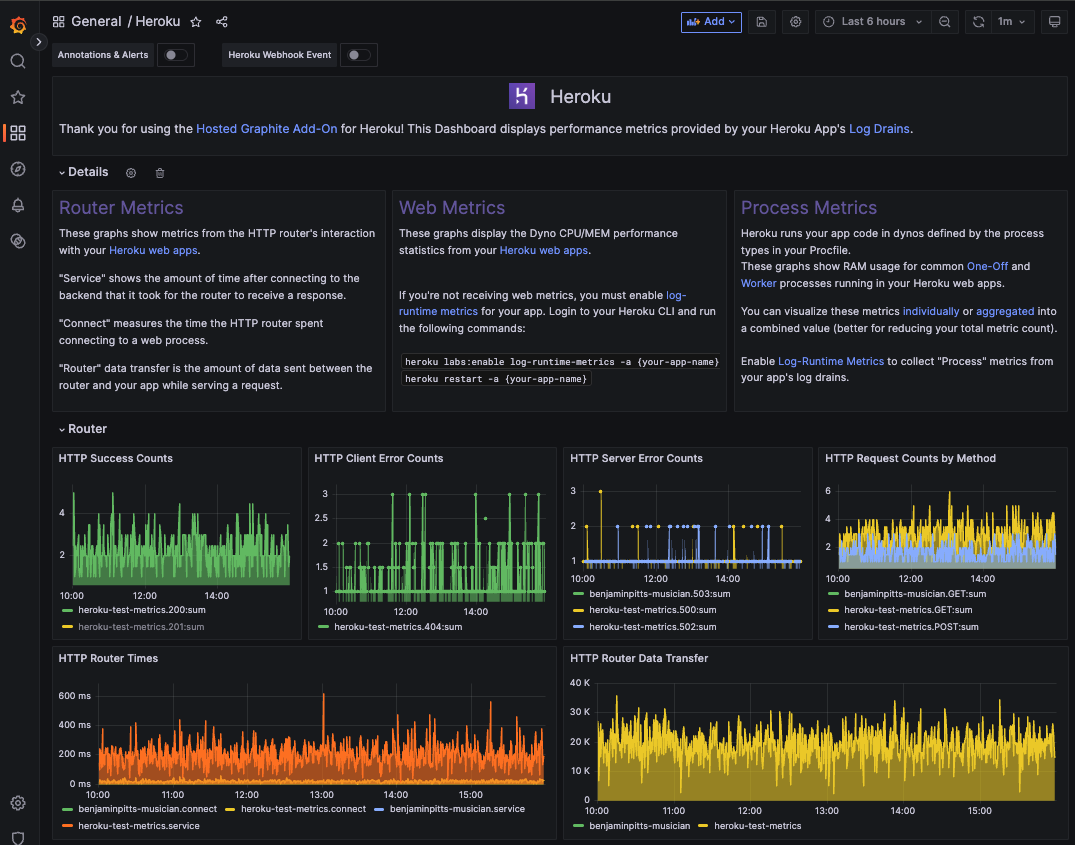
When you provision the Hosted Graphite add-on for your Heroku app, four useful dashboards are automatically created for you and render data as soon as your app logs are pulled into the HG backend. Simply run these commands from within your Heroku CLI to provision and open the Hosted Graphite add-on:
- heroku addons:create hostedgraphite -a <app-name>
- heroku addons:open hostedgraphite -a <app-name>
Hosted Graphite comes with a hosted Grafana environment, regardless of plan level. Check out the Heroku Dyno dashboard panels here:
Heroku Monitoring tools
Heroku monitoring tools come in two kinds: the default metrics UI and celatpkearthe madd-ons. The default Heroku monitoring helps you see that systems are running, but you can’t create custom visualizations or alerts. You won’t be able to get really detailed information about your specific system with just the default metrics. In order to monitor your databases, tools, systems, logs, and cloud providers, you’ll need a tool that can do more.
HG Heroku monitoring specializes in server metrics, and ingesting custom metrics at scale. Not only do we have the platform for piping in custom metrics and logging, we do it low cost, with consistent pricing even when your number of metrics grow.
What is Hosted Graphite and the HG Heroku Monitoring tool?
Hosted Graphite provides a complete infrastructure and application monitoring platform from a suite of open source monitoring tools. Let us manage your monitoring setup so you don't have to!
MetricFire's Hosted Graphite offers a wide range of supported tools, add-ons, and integrations which make it possible to measure, analyze and visualize large amounts of data about your applications with ease. If you would like to learn more about it, jump onto our listing and install the add-on! You can start using HG Heroku monitoring in just one click!
Heroku Monitoring dashboards
The Heroku Dashboard is the main user interface for interacting with the platform. There you can manage your apps and pipelines, view app metrics, configure add-ons and view invoice and billing information.
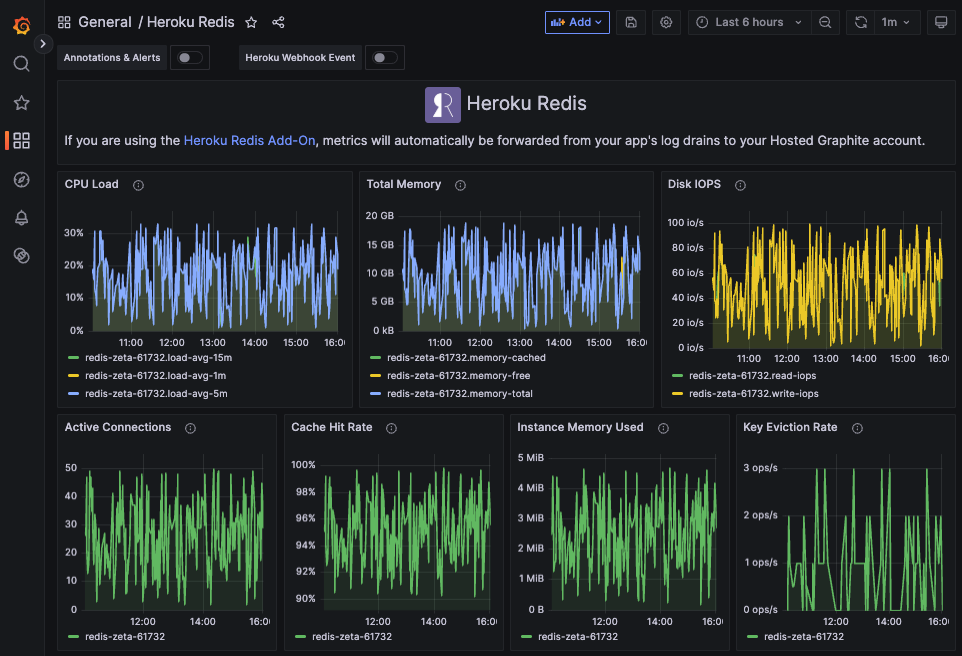
Metrics from your running instances of Heroku Postgres, Redis, and Kafka are also pulled into Hosted Graphite automatically, as soon as the HG add-on is provisioned for your Herokuapp:
Customizing Your Heroku Metrics
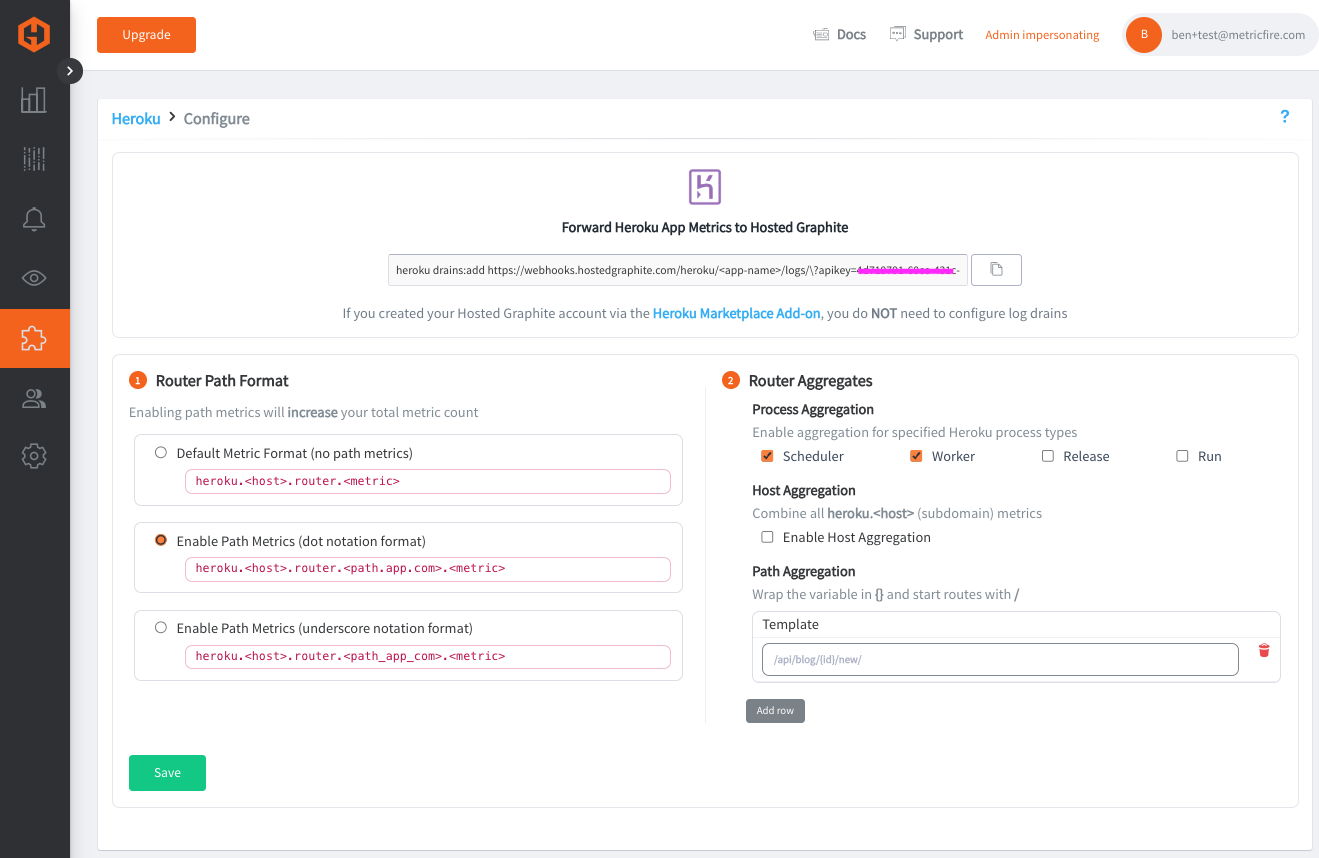
In the Hosted Graphite app, navigate to Add-Ons ⇒ Heroku to access all of the following configuration options.
Router Path Metrics
If you enable the Path Metrics feature in the Heroku config, we will collect and forward router statistics (connection times, request methods/statuses) per path in your Heroku application. This will increase the total number of metrics being stored in the Hosted Graphite backend, but will give you increased visibility into activity within your app, and a higher level of alerting functionality.
Process Aggregates
Heroku runs your app code in Dynos defined by One-Off and Worker process types in your Procfile (you must have Log-Runtime Metrics enabled on your Heroku app to receive process metrics).
This feature rolls up multiple process instance IDs into a single metric stream, which is good for reducing cardinality and giving you a good performance overview. By default, you will receive individual process metrics, but we recommend enabling aggregation per process to significantly decrease your total metric count.
Host Aggregates
Some Heroku apps report router metrics under multiple hostnames, such as a mix of your Heroku default domain (myapp.herokuapp.com), a custom domain (www.herokuapp.com), or internal service domains (UID-123.herokuapp.com). These hostname variations will produce multiple metric series even though they represent the same application.
Detailed installation instructions on how to use the Heroku Hosted Graphite monitoring add-on can be found in the Hosted Graphite docs. Once installed, metrics forwarded by your Heroku app's logs are stored in the Hosted Graphite backend and used to create custom dashboards and service-level alerts.
Conclusion
This article covers some basics of Heroku applications and how one can approach the metrics collection and performance monitoring. In a production environment, it is recommended to use one of the available monitoring tools, such as HG Heroku monitoring. HG Heroku monitoring is one option when it comes to monitoring a Heroku application or a pipeline.
If you would like to learn more about the product, visit the listing and get into the platform! If you have any questions, message us on our chat and we’ll respond within 5 minutes!


.png)

.svg)