
Heroku Monitoring with Hosted Graphite
Hosted Graphite is a full-scale framework that provides infrastructure and application monitoring using a suite of open-source technologies. The platform ingests Graphite data in the form of dot.notated.metrics which can be used for Grafana dashboards and custom alerts.
Hosted Graphite also manages a Heroku addon that handles your Heroku app monitoring directly from the Heroku platform. Check out the HG Heroku monitoring tool here. You can install the Hosted Graphite add-on in your Heroku app, and get automatically created dashboards to visualize the performance of your Heroku app. Check out one of the automatic Heroku dashboards here:
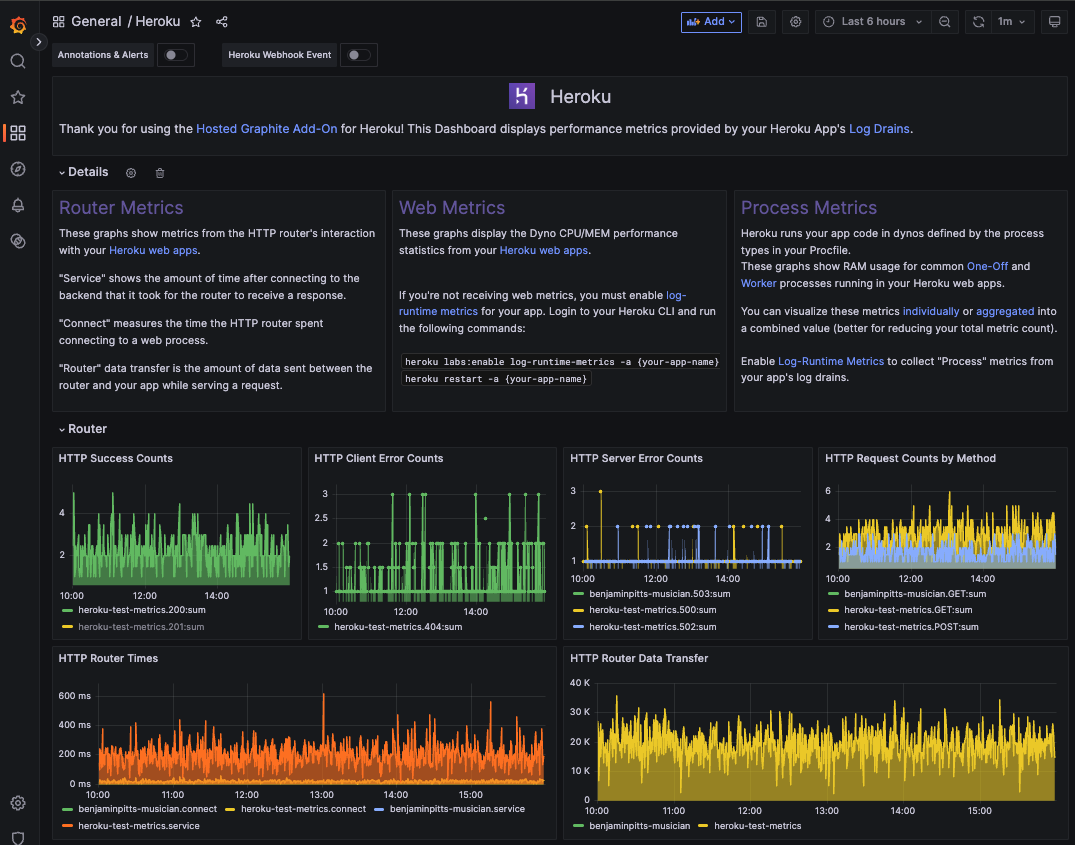
To try out the HG Heroku Monitoring tool, get on to the listing and install the addon. You can speak to our support team directly in-app through the intercom chat!
Heroku monitoring with Hosted Graphite
Today, you have a few tools to choose from in the Heroku addon marketplace. HG Heroku Monitoring brings the flexibility of hosted open source tools to Heroku. HG Heroku Monitoring is a platform built on the open source Graphite, Grafana, and StatsD - so regardless of what you’re trying to monitor, you can easily pull it into your HG Heroku Monitoring dashboards.
The platform is great for monitoring your Heroku app directly, but you can also pull in data sources from outside of Heroku, such as AWS, Azure, GCP, and Digital Ocean. You can monitor infrastructure, applications, systems, and business metrics directly from within the HG Heroku Monitoring platform.
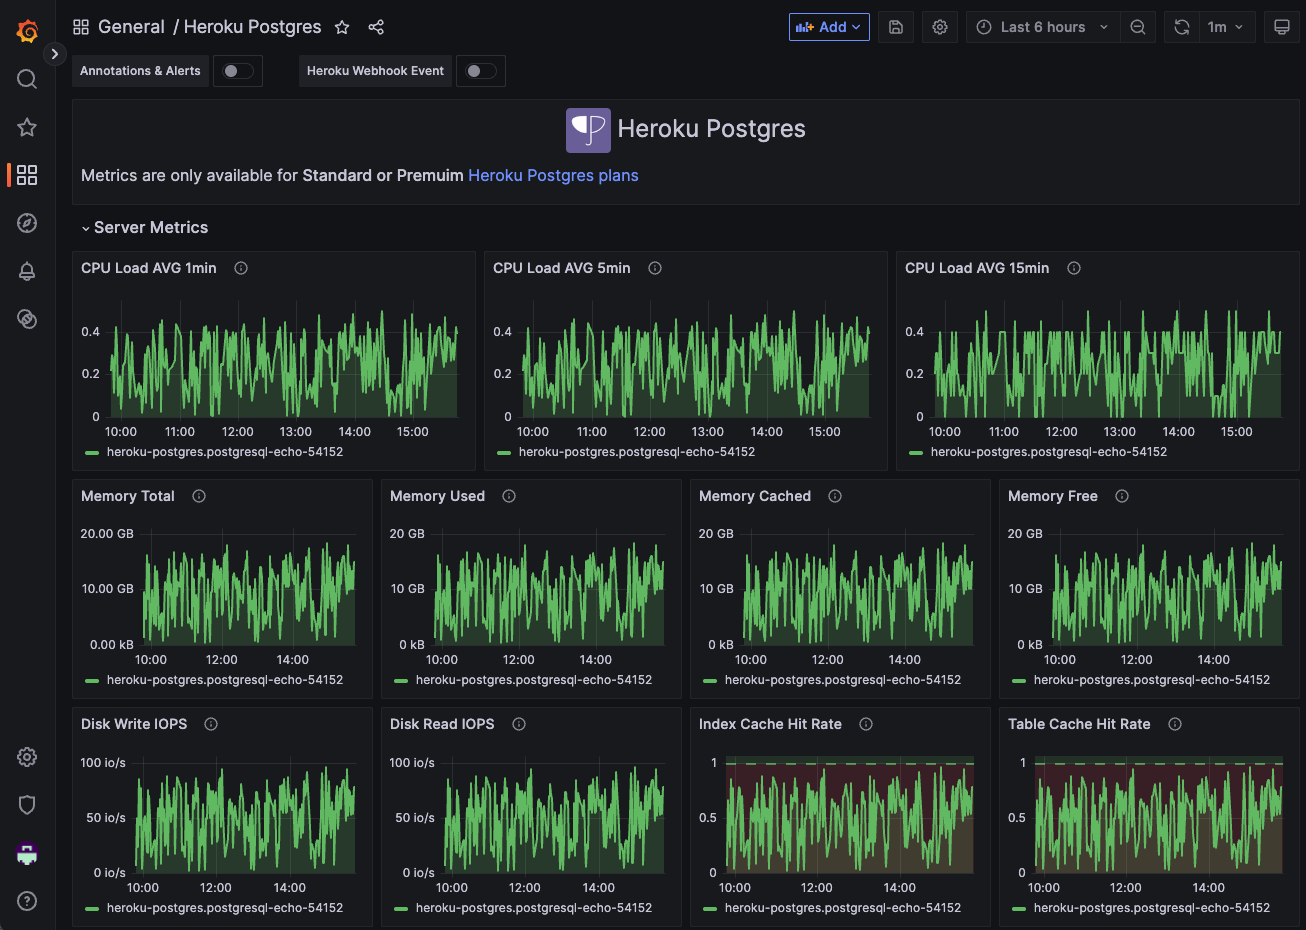
Check out our Heroku Postgres dashboard:
Installing the Heroku Hosted Graphite Add-on
The Heroku Marketplace Listing
The easiest way to get started is to install the HG Heroku Monitoring tool directly from the Heroku marketplace. It’s as easy as one click between you and your new dashboards:
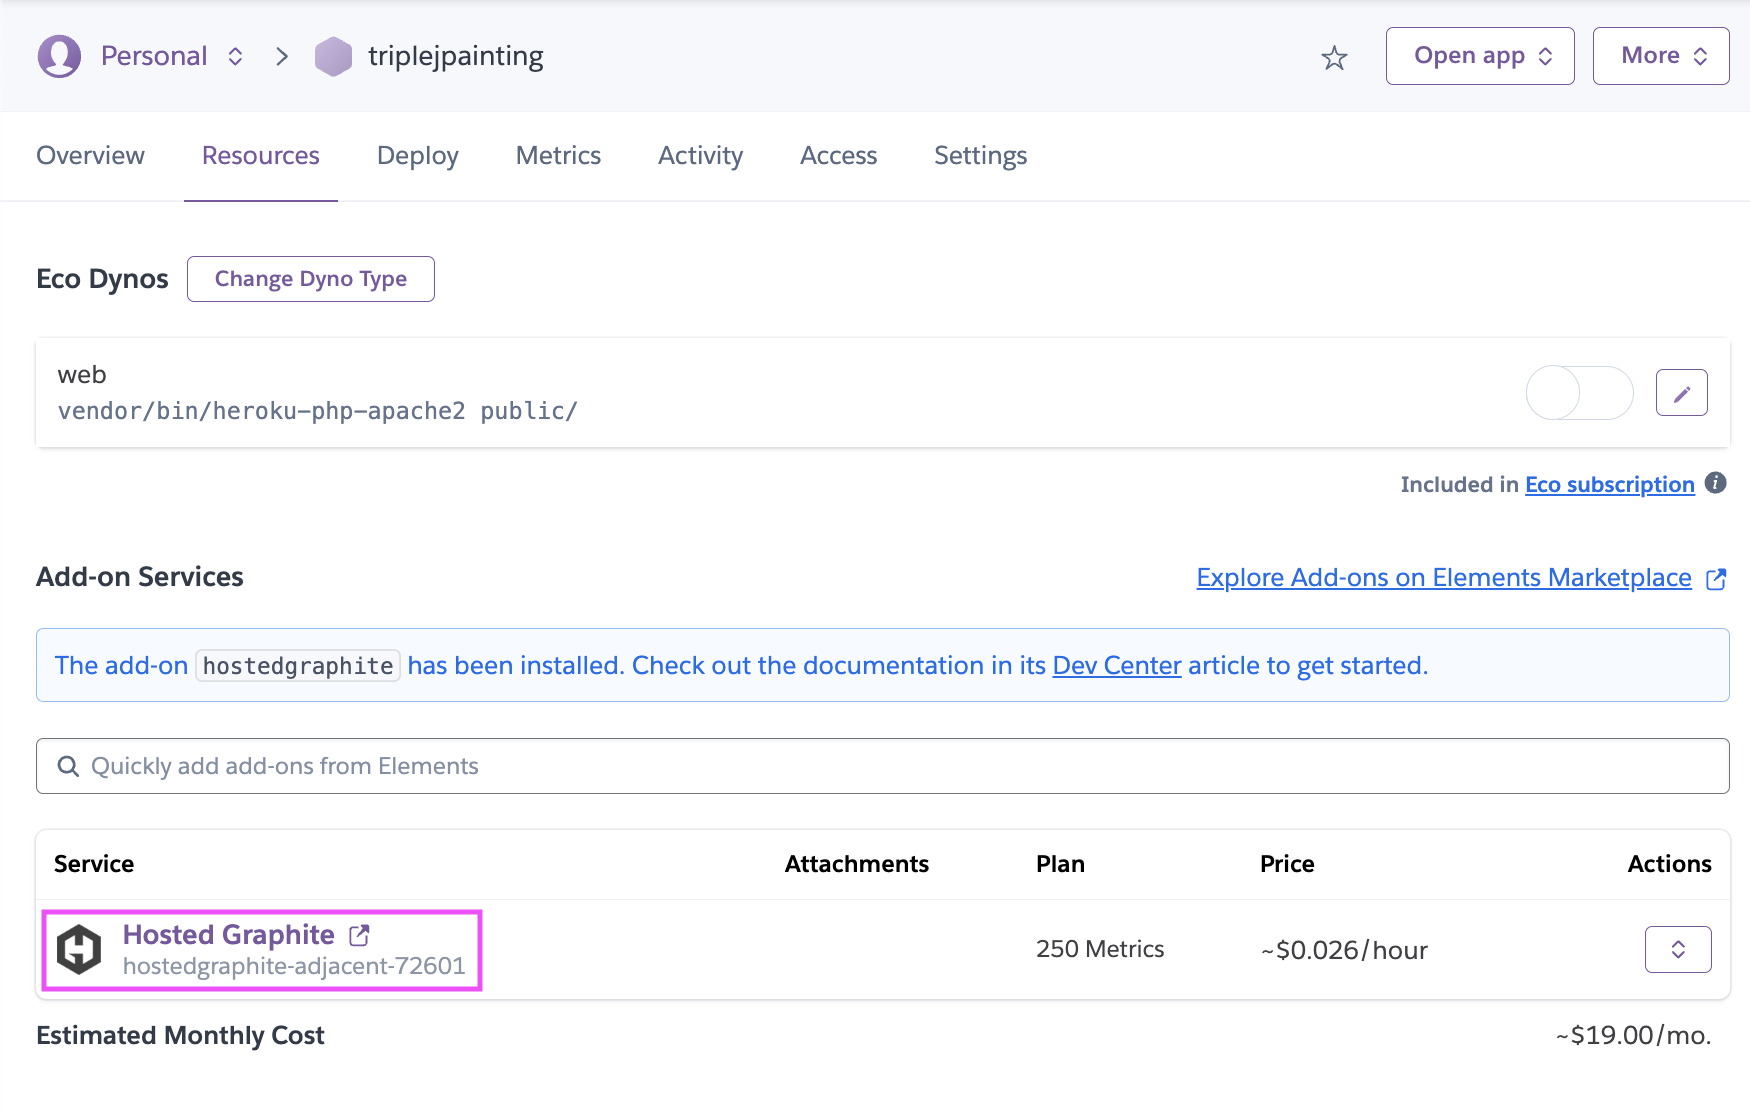
Alternatively, you can provision the add-on and open the HG app from running only 2 commands within your Heroku CLI:
- heroku addons:create hostedgraphite -a <app-name>
- heroku addons:open hostedgraphite -a <app-name>
From the Hosted Graphite Application
You can also install the Heroku add-on through the Hosted Graphite app, on the Hosted Graphite website. Get into the Hosted Graphite 14-day free trial here, and start monitoring your Heroku app immediately. Once you're in the app, navigate to the add-ons section and click into the Heroku add-on:
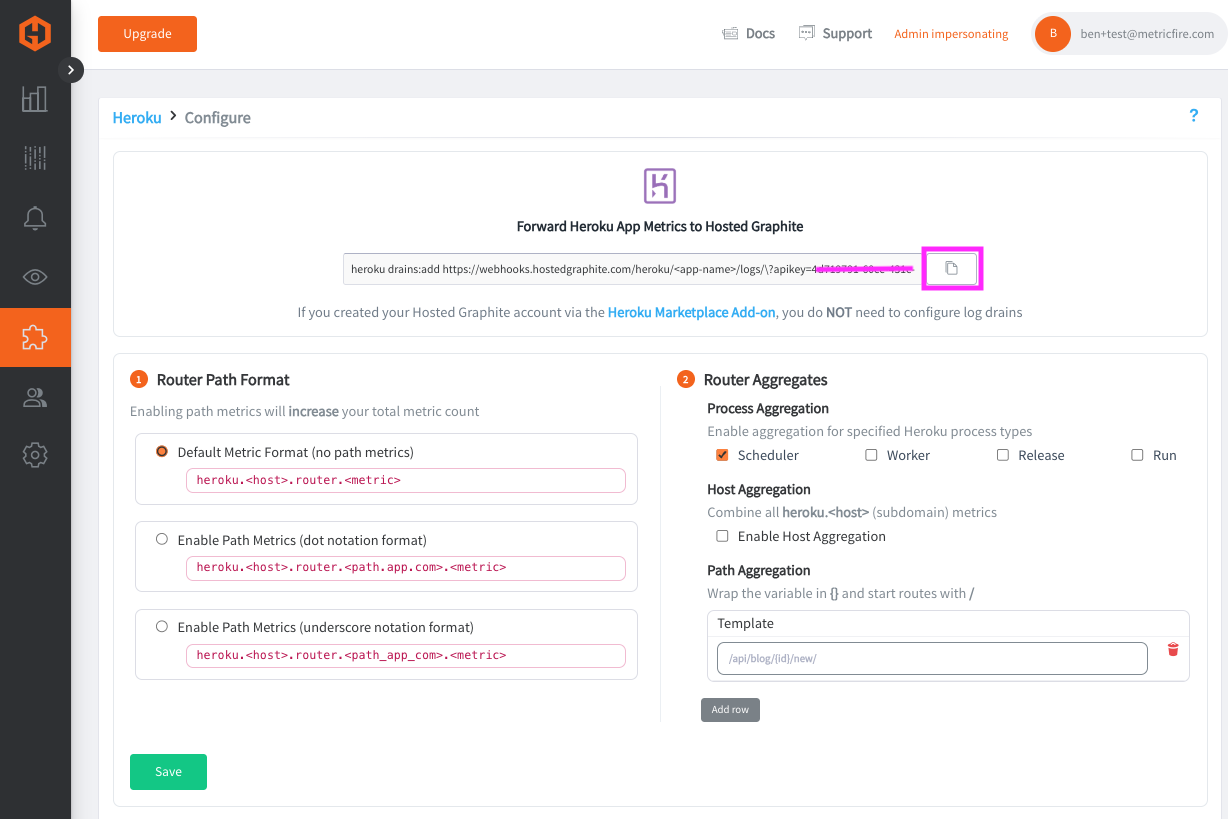
Copy and paste the drains:add command, and run it from within your Heroku CLI. This forwards your app logs to the HG webhooks endpoint, where your log events are converted into the Graphite format, and forwarded to the HG backend for ingestion, aggregation, and storage.
Customizing Your Heroku Metrics
In the Hosted Graphite app, navigate to Add-Ons ⇒ Heroku to access all of the following configuration options.
Router Path Metrics
If you enable the Path Metrics feature in the Heroku config, we will collect and forward router statistics (connection times, request methods/statuses) per path in your Heroku application. This will increase the total number of metrics being stored in the Hosted Graphite backend, but will give you increased visibility into activity within your app, and a higher level of alerting functionality.
Process Aggregates
Heroku runs your app code in Dynos defined by One-Off and Worker process types in your Procfile (you must have Log-Runtime Metrics enabled on your Heroku app to receive process metrics).
This feature rolls up multiple process instance IDs into a single metric stream, which is good for reducing cardinality and giving you a good performance overview. By default, you will receive individual process metrics, but we recommend enabling aggregation per process to significantly decrease your total metric count.
Host Aggregates
Some Heroku apps report router metrics under multiple hostnames, such as a mix of your Heroku default domain (myapp.herokuapp.com), a custom domain (www.herokuapp.com), or internal service domains (UID-123.herokuapp.com). These hostname variations will produce multiple metric series even though they represent the same application.
Monitoring a basic application with StatsD
We’ve built a simple app called “metricfire_demo”. We’re going to monitor “metricfire_demo” using the Heroku add-on from the Hosted Graphite app.
Applying the API key from the previous section, the picture below shows the performance:

Next to our Heroku environment variables, we need to add our API key. Execute the configuration Heroku set HOSTEDGRAPHITE APIKEY = YOUR API KEY:
- heroku config:get HOSTEDGRAPHITE_APIKEY -a <app-name>
Now let's configure StatsD on our app to send metrics to HG when an event happens. For this example, we’ll monitor two buttons and report each click event as a metric with the numeric value of 1. First, make sure to Enable our Hosted StatsD in the HG Add-ons section:
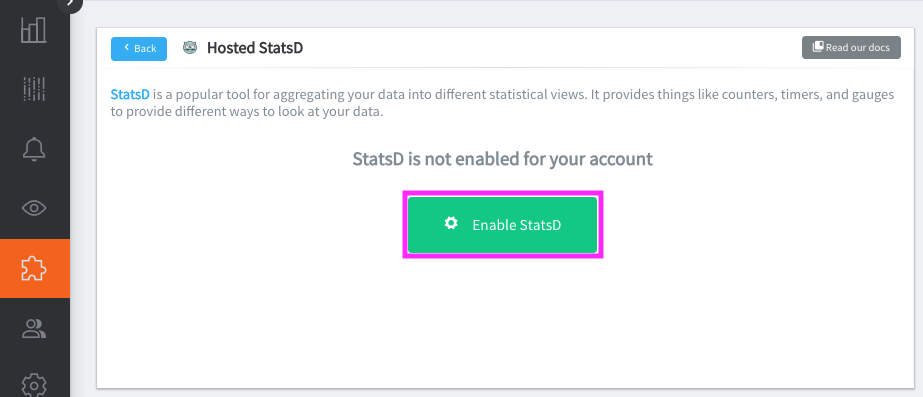
Then you can configure your local StatsD in a similar way to this:
import os
import statsd
from django.shortcuts import render
from django.http import HttpResponseRedirect

api_key = os.environ["HOSTEDGRAPHITE_APIKEY"]

c = statsd.StatsClient(
    "statsd.hostedgraphite.com",
    8125,
    prefix=api_key
)


def home(request):
    context = {}
    return render(request, "dashboard/index.html", context)


def login(request):
    c.incr("demo.metric.login_button")
    return HttpResponseRedirect("/")


def badpage(request):
    c.incr("demo.metric.support_button")
    return HttpResponseRedirect("/")
Save the config and restart your StatsD instance. Now you should be able to click the login/support buttons on your demo app, and the corresponding metrics will be sent to the HG carbon endpoint. For a more detailed guide on this example, please see our Custom StatsD Metrics video tutorial HERE.
Visualizing StatsD on Grafana with Hosted Graphite
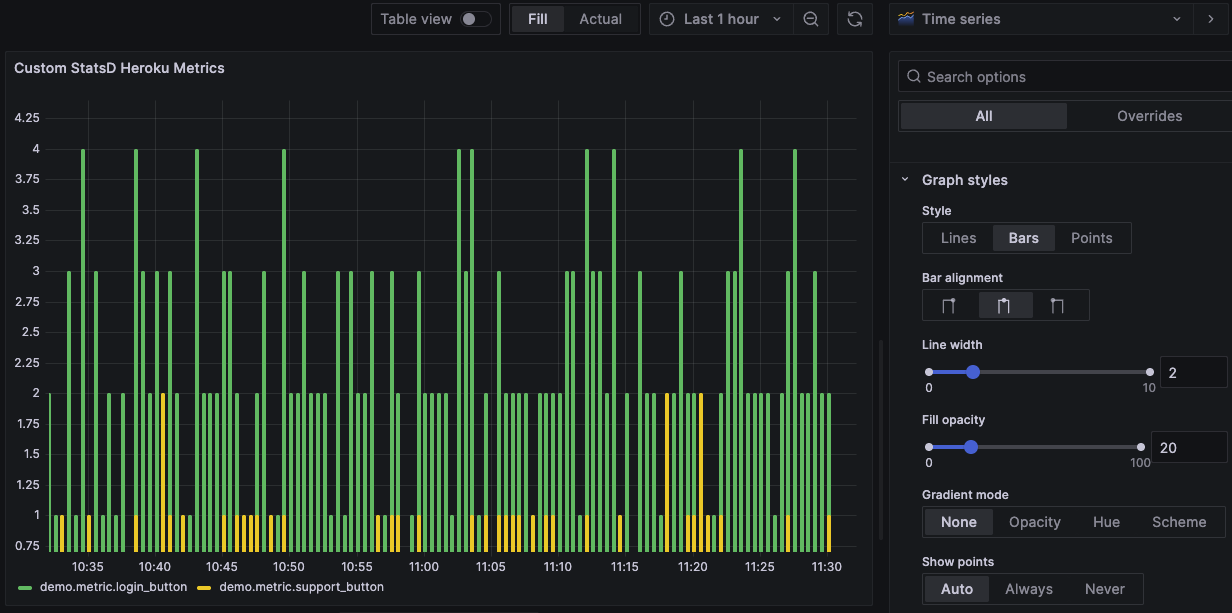
Now that our application is sending StatsD metrics to Hosted Graphite, we can visualize them in Grafana. In our example, we're using StatsD counters to track how often users click the Login and Support buttons:
c.incr("demo.metric.login_button")
c.incr("demo.metric.support_button")
Each time one of these actions occurs, the corresponding counter is incremented and sent to Hosted Graphite.
In your Hosted Graphite account, create a new Grafana dashboard and add a panel for these metrics. You can then query the login_button and support_button metrics and display them together to compare how frequently each action occurs.
For example, displaying the metrics as bars makes it easy to see which buttons are being clicked and how their usage changes over time. In a production application, the same approach can be used to track user actions, application events, errors, or other custom metrics that are important to your application.
Conclusion
With Hosted StatsD and Grafana, you can quickly turn application events into metrics that can be monitored, visualized, and alerted on from Hosted Graphite. If you want to check it out, continue to the FREE 14-day trial of MetricFire's Hosted Graphite and start submitting metrics for your Heroku submission.
You can also get onto the HG Heroku Monitoring listing and get your Heroku monitoring with a single click! When you get into the HG Heroku app you can talk to our team directly through the support chat!


.png)

.svg)