
To Optimize Your App on Heroku, Make Sure to Monitor Memory Usage
At the infrastructure level, there are several components to look into to optimize a Heroku app. These can include dyno size, CPU performance, process types, and memory usage. In this post, we’ll focus on monitoring memory usage as a key step in getting the most from a Heroku app. Specifically, we’ll go over the following topics:
- Understanding memory usage on Heroku
- Choosing the metrics so you can easily monitor memory usage
- Using an add-on to monitor memory usage
The HerokuHosted Graphite add-on by MetricFire enables you to monitor memory usage on your app quickly and easily. It combines the time-series data-handling capabilities of Graphite and robust data visualization features from Grafana into a ready-to-use add-on. Attach it to your app right away with a one-click installation, by running these commands from within your Heroku CLI:
- heroku addons:create hostedgraphite -a <app-name>
- heroku addons:open hostedgraphite -a <app-name>
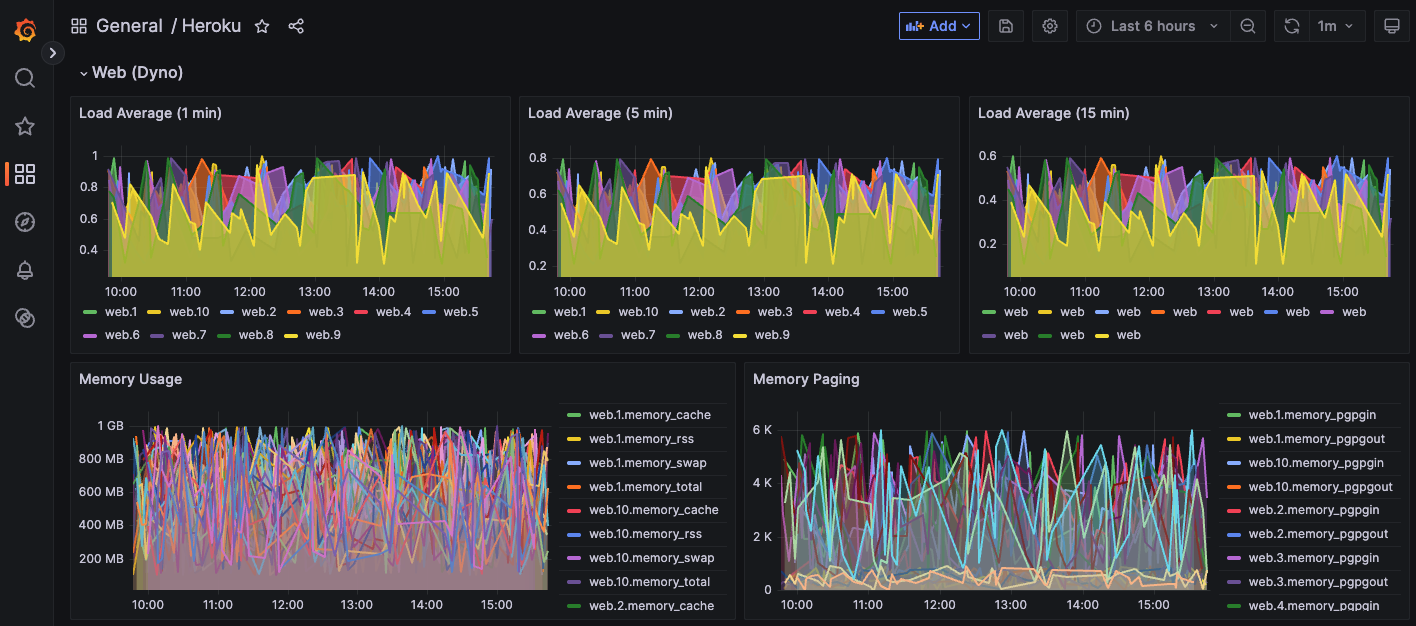
Once you install the add-on, HG Heroku monitoring will automatically generate Heroku-specific dashboards for you, check it out:
Understanding memory usage on Heroku
To monitor memory usage at the dyno level, you need to gain visibility. This allows you to:
- Identify memory issues before they affect your app’s performance
- Ensure that the minimum required amount of memory is maintained
- Avoid exceeding memory quota for a given dyno plan
When your app uses more memory than what’s available in a dyno, the application encounters an R14 error. When this happens, Heroku allots swap memory to the process in order to make up for the deficit. But using swap memory tends to adversely affect your app’s response time. This is why monitoring memory consumption is an essential step in optimizing your app’s performance.
To monitor memory usage at the dyno level, you need to gain visibility. This allows you to:
- Identify memory issues before they affect your app’s performance
- Ensure that the minimum required amount of memory is maintained
- Avoid exceeding the memory quota for a given dyno plan
When your app uses more memory than what’s available in a dyno, the application encounters an R14 error. When this happens, Heroku allows swap memory to the process to make up for the deficit. However, using swap memory tends to adversely affect your app’s response time. This is why monitoring memory consumption is an essential step in optimizing your app’s performance.
Choosing the metrics to monitor for visibility into memory usage
Heroku’s memory usage metrics give insight into the total memory usage, swap usage, and memory quota for a process type (i.e., web or worker process). Heroku Labs’ log-runtime-metrics give visibility into memory consumption and swap with the following indicators:
- Resident Memory (memory_rss)
- Disk Cache Memory (memory_cache)
- Swap Memory (memory_swap)
- Total Memory (memory_total)
- Memory Quota (memory_quota)
- Pages Written to Disk (memory_pgpgout)
- Pages Read from Disk (memory_pgpgin)
If not yet available in your app’s metric dashboard, these metrics can be collected by enabling log-runtime-metrics and restarting your app:
- heroku labs:enable log-runtime-metrics -a <app-name>
- heroku restart -a <app-name>
Using the HG add-on for memory usage monitoring
Let’s take a look at how to provision and set up a Heroku add-on for memory usage monitoring. We use the Hosted Graphite Heroku add-on because it gives us the power of Graphite time-series data management and Grafana data visualization with minimal configuration and setup.
First, attach the add-on to your app by running this command from within your Heroku CLI:
- heroku addons:create hostedgraphite -a <app-name>
Once provisioned, the add-on will collect a base set of performance metrics (CPU, memory, and I/O metrics) and forward the data points to a Grafana dashboard. To make sure you’re tracking the full set of key memory usage metrics, enable log-runtime-metrics as indicated in the previous section.
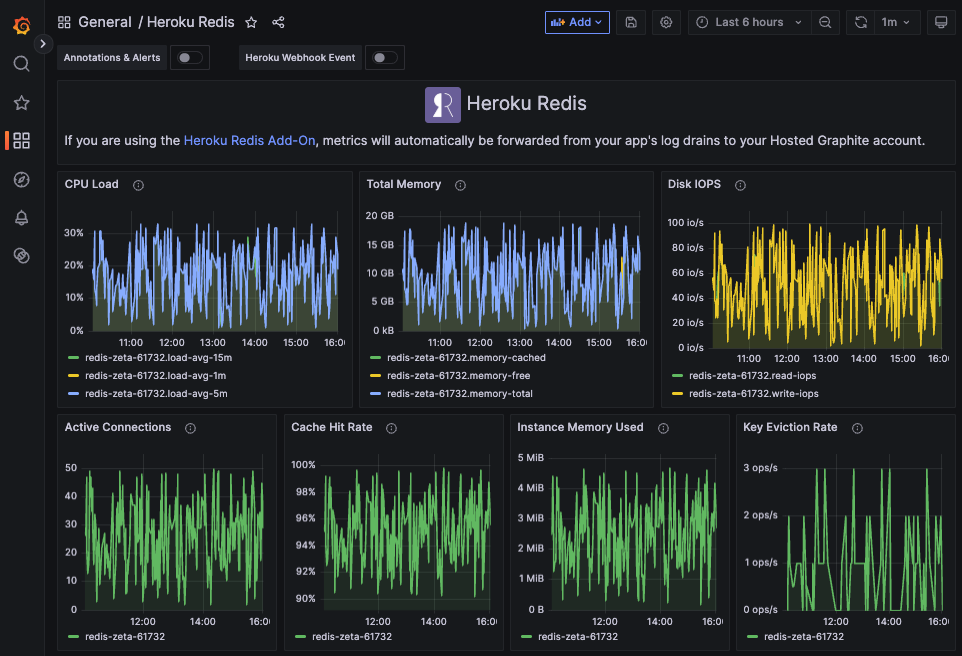
The Hosted Graphite Heroku add-on automatically generates a Grafana dashboards which display the collected app statistics, including the memory usage metrics. Additionally, Heroku metrics are also ingested from your other Heroku add-ons (Postgres, Redis, Kafka), as well as Process metrics (worker, scheduler, release, run), and Herokuconnect stats (operations, sync durations):
Another benefit of using the Hosted Graphite Heroku add-on is that you can easily include other metrics and create custom dashboards and alerts, without doing additional configuration. Hosted Graphite can handle collecting and storing a huge volume of time-series data as well as thousands of metric types.
With the Hosted Graphite add-on, you can do much more than just monitor your dynos. You can configure composite (conditional) alerts, and send metrics from you self-hosted servers, and cloud services (AWS, Azure, GCP, DigitalOcean).
Additionally, MetricFire's Hosted Graphite integrates with a long list of popular technologies, and offer engineer-level support to get you up and running quickly, starting at only $19/mo.
Conclusion
You’re now ready to start optimizing your Heroku app with the help of robust memory usage monitoring. The next step is to gain more hands-on experience with tools like Hosted Graphite. Monitoring Heroku Memory usage has never been easier than with the Hosted Graphite Heroku monitoring add-on!


.png)

.svg)