
Heroku Java Monitoring
Monitoring a Java application on Heroku is a little different from monitoring a typical web process. Your application runs inside a JVM, the JVM runs inside a Heroku dyno, and each layer can tell you something different when performance starts to change.
For example, Heroku might show that a dyno is approaching its memory quota which is useful, but it doesn't tell you whether the Java heap is filling up, garbage collection is running more frequently, or if memory is being consumed outside of the heap. A useful Heroku Java monitoring setup looks at both sides:
- JVM metrics to understand Java memory and garbage collection
- Heroku metrics to understand dyno resources, HTTP traffic, processes, and the rest of the environment around your Java application
Heroku provides JVM-specific runtime metrics through Application Metrics, while the Hosted Graphite Heroku add-on can monitor the Heroku infrastructure around your JVM and collect custom metrics directly from your Java application.
JVM Monitoring on Heroku
Heroku provides optional language runtime metrics for applications running on the JVM. These add JVM-specific information to Heroku Application Metrics, including:
- Heap memory
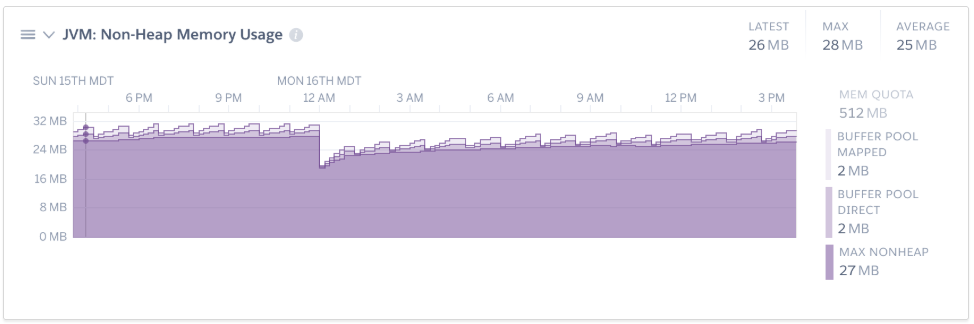
- Non-heap memory
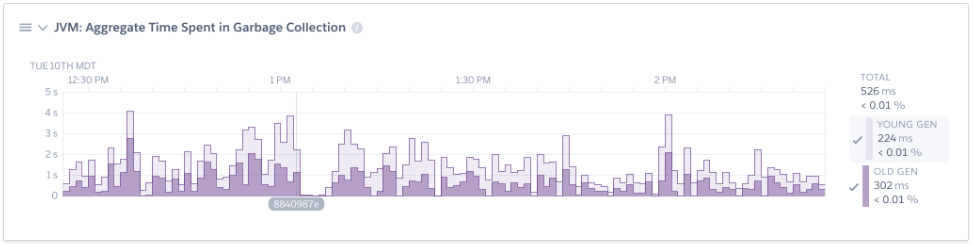
- Garbage collection activity
These metrics are useful because Java heap usage and total dyno memory usage aren't the same thing. The heap is where Java stores class instances and other objects and it's size can be controlled using JVM options such as -Xms and -Xmx,
But the JVM uses memory outside the heap as well. Metaspace stores class definitions. Thread stacks contain local variables, object references, and method calls for each thread. The JVM itself also consumes native memory that won't necessarily appear in heap monitoring.
So imagine Heroku reports that a dyno is using 900 MB of memory, while your JVM heap is only using 500 MB. That remaining memory hasn't disappeared. Some of it may be thread stacks, Metaspace, native libraries, or JVM overhead. This distinction is particularly important when you're troubleshooting memory problems.
Using JVM Metrics to Investigate Memory
A healthy Java heap normally doesn't move in a straight line.
Your application creates objects, heap usage increases, and eventually garbage collection runs and reclaims objects that are no longer needed. You'll typically see heap usage fall after a collection.
Heroku's JVM metrics let you watch that behavior directly through heap and non-heap memory plots and garbage collection activity.
For example, suppose heap usage repeatedly grows from 250 MB to 500 MB and then drops back down after garbage collection. That may simply be normal behavior for the application.
A more interesting case is when the baseline keeps increasing:
250 MB => GC => 180 MB
350 MB => GC => 260 MB
450 MB => GC => 340 MB
550 MB => GC => 430 MB
Now the JVM is reclaiming memory, but each collection is leaving more behind than the previous one so that's already a good reason to investigate what your application is retaining. Garbage collection itself can also be a useful signal because if GC activity suddenly becomes much more frequent, the JVM may be spending more time trying to make room in the heap. So the important part is the pattern rather than one individual measurement.
JVM Memory vs. Heroku Dyno Memory
This is where JVM monitoring and Heroku monitoring start to complement each other.
Heroku dynos have a memory quota based on their dyno type. On Cedar-generation dynos, if an application exceeds that quota, Heroku can begin paging memory to disk and generate an R14 - Memory quota exceeded error. Heroku notes that this paging can seriously hurt application performance.
An R14 might look something like: Error R14 (Memory quota exceeded)
But an R14 doesn't necessarily mean your Java heap is too large.
Suppose your dyno metrics show:
Total dyno memory: 950 MB
JVM heap: 550 MB
Increasing -Xmx would be the wrong direction if the problem is actually the other 400 MB being consumed outside the heap.
Heroku specifically recommends looking at the difference between Total RSS and JVM Heap when investigating high native memory usage, giving you a useful troubleshooting path:
Dyno memory is high → check JVM heap → compare heap with Total RSS → investigate where the remaining memory is going.
Digging Deeper into the JVM
Graphs are good at showing you that something changed. Once you've identified a problem, Java's own tools can help figure out why.
Heroku Exec allows you to connect directly to a running dyno:
$ heroku ps:exec --app <app-name>
You can then find the Java process:
$ jps
If the PID is 4, for example, you can generate a thread dump with:
$ jstack 4
A thread dump is useful if the application appears stuck or you suspect that threads are blocked or otherwise behaving unexpectedly. For memory problems outside the heap, Java's Native Memory Tracking can go deeper. After enabling Native Memory Tracking, you can run:
$ jcmd 4 VM.native_memory summary
The output breaks memory usage into categories such as:
Java Heap
Class
Thread
Heroku's own example shows why this can be useful: the JVM can have hundreds of megabytes committed to the Java heap while simultaneously reserving or committing substantial additional memory for classes and thread stacks.
Threads are an especially easy source of memory to overlook. Each thread gets its own stack, and Heroku's Java defaults currently set -Xss512k. An application creating a large number of threads can therefore consume a meaningful amount of memory outside the heap.
Monitoring the Heroku Side with Hosted Graphite
Heroku's JVM metrics tell you what's happening inside the JVM. Hosted Graphite doesn't ingest those JVM runtime metrics, so we don't want to pretend they're part of the HG dashboard.
Instead, Hosted Graphite gives you visibility into what's happening around the JVM.
After installing the Hosted Graphite Heroku add-on, your application's log drain is forwarded to Hosted Graphite. With Heroku log-runtime metrics enabled, HG automatically collects metrics including:
- CPU load averages
- Memory and RSS
- Swap
- Memory quota
- HTTP router service and connection times
- HTTP methods and status codes
- Supported Heroku process metrics
Hosted Graphite then automatically creates Heroku Grafana dashboards from that data which quickly gives you another side of the Java troubleshooting story.
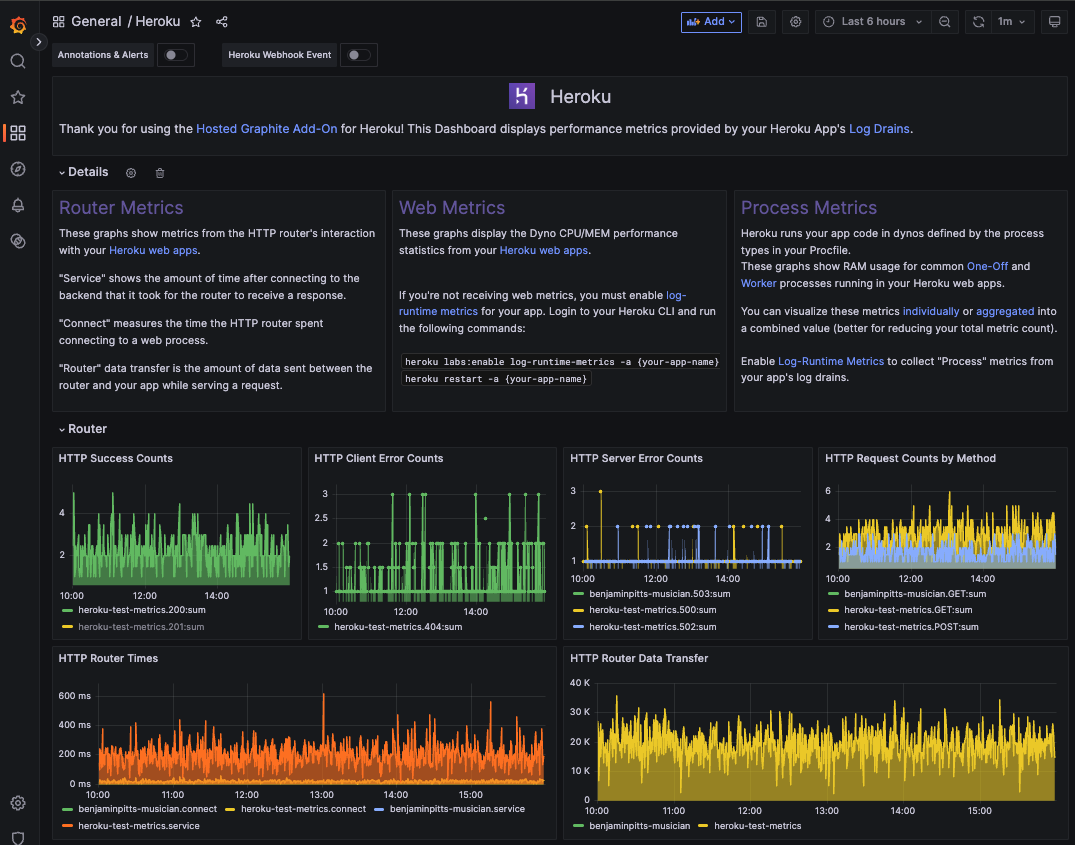
Maybe Heroku's JVM metrics show increasing garbage collection activity. In Hosted Graphite, you can check whether that same period also shows increased dyno memory, slower HTTP service times, or an increase in 500 responses. Or perhaps the JVM looks fine, but HG shows that your Java worker's dyno memory is steadily increasing. That's a reason to start looking outside the heap with tools like Native Memory Tracking.
To get started, simply run these commands from within your Heroku CLI to provision and open the Hosted Graphite add-on:
- heroku addons:create hostedgraphite -a <app-name>
- heroku addons:open hostedgraphite -a <app-name>
Adding Custom Java Metrics to Hosted Graphite
Infrastructure metrics still don't tell you whether your Java application is actually doing its job.
Hosted Graphite also supports sending custom metrics directly from Java. When you provision the Heroku add-on, your application gets a HOSTEDGRAPHITE_APIKEY config variable that can be used when submitting metrics.
For example, imagine a Java worker processes jobs from a queue. You might send metrics such as:
jobs.processed
jobs.failed
queue.depth
job.processing_time
A web application might instead track:
checkout.requests
checkout.errors
checkout.latency
A basic Java TCP example looks like this:
String apikey = System.getenv("HOSTEDGRAPHITE_APIKEY");

Socket conn = new Socket("carbon.hostedgraphite.com", 2003);
DataOutputStream dos = new DataOutputStream(conn.getOutputStream());

dos.writeBytes(apikey + ".jobs.processed 1\n");

conn.close();
Hosted Graphite also supports UDP, HTTP, TLS over TCP, Pickle, and StatsD ingestion depending on how you want to instrument the application. Now you have several different views of the same Java service:
- JVM: Is heap usage or garbage collection changing?
- Heroku/HG: Is the dyno running out of memory, getting busier, or serving requests more slowly?
- Application: Are jobs failing, queues growing, or requests taking longer?
That's a much more useful monitoring setup than relying on any one layer by itself.
Conclusion
Heroku Java monitoring works best when you don't treat the JVM and the dyno as the same thing. Heroku's JVM runtime metrics give you visibility into heap, non-heap memory, and garbage collection. When you need to dig deeper, tools like jstack and jcmd can help investigate threads and native memory. Heroku's language runtime metrics currently require classic buildpacks and aren't available on Eco or Fir dynos.
The Heroku Hosted Graphite monitoring add-on covers the environment around the JVM by monitoring your Heroku dynos, processes, and HTTP router metrics. You can also send custom metrics directly from your Java application to connect infrastructure behavior with what the service is actually doing.
Put those layers together and you have a much better answer when a Java app starts acting strangely than simply knowing that "memory is high."


.png)

.svg)