
Heroku Enterprise Monitoring
Heroku makes it pretty easy to scale an application. Add more dynos, split work across different process types, attach Postgres or Redis, and keep going. Eventually, though, all that infrastructure starts producing a lot of metrics.
Heroku Enterprise environments are an obvious example because they can span multiple applications, teams, services, databases, and hundreds of running processes. But you don't need to be on a specific "Enterprise" plan to run into enterprise-scale monitoring problems. Any large Heroku application can reach the point where the monitoring infrastructure becomes a serious workload of its own.
For a smaller app, monitoring a few dynos and some HTTP traffic isn't particularly difficult. But at scale, you may have hundreds of processes, thousands of routes, multiple databases and services, and a huge number of custom application metrics all sending data at the same time. Your dashboards are querying more series, your alerts are evaluating more data, and suddenly the monitoring stack needs to scale right alongside the application.
The Heroku Hosted Graphite Monitoring Add-on is built for exactly this kind of workload. We store millions of metric namespaces and ingest billions of data points every day, while providing a managed Graphite and Grafana environment for querying, visualizing, and alerting on all of it.
So while we'll talk about Heroku Enterprise monitoring throughout this article, the same approach applies to any Heroku application operating at serious scale. Your monitoring shouldn't become another production system your team has to babysit!
The Problem With Graphite at Scale
Graphite is great at storing and querying time-series data, but running a large Graphite stack yourself is a different story.
As metric volume grows, you're no longer maintaining a Graphite server and a Grafana instance. You're maintaining an ingestion pipeline, storage infrastructure, aggregation policies, retention policies, backups, Graphite-Web, Grafana, and all the infrastructure required to keep those pieces responsive. And your metric queries become part of the scaling problem too. Consider a Graphite query like:
servers.*.requests.200
On a small installation, that wildcard may only match a handful of metrics but imagine that same query across hundreds or thousands of servers. Add a Grafana dashboard containing 20 panels, multiple wildcard queries per panel, a long time range, and several engineers loading the dashboard at once. Those innocent-looking queries can suddenly become pretty expensive.
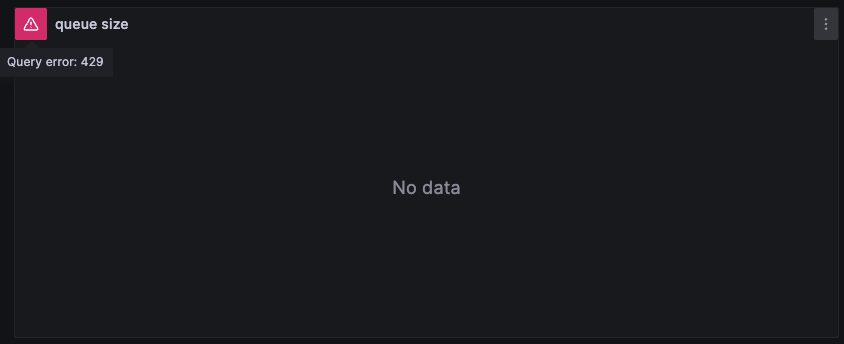
This is where self-hosted Graphite/Grafana environments can start struggling with slow panels, timeouts, and failed requests. And unfortunately, the time you're most likely to hammer those dashboards is when something is already going wrong.
Hosted Graphite Is Built for Large Queries
We've spent a lot of years working on the less glamorous parts of running Graphite at scale so our customers don't have to. Hosted Graphite automatically handles ingestion, aggregation, storage, retention, and querying across a distributed backend.
We also store metrics at multiple resolutions (5s, 30s, 300s, 3600s). Recent data is kept at high resolution, while longer time ranges use aggregated data appropriate for the query. So if you're looking closely at recent activity, you get detailed data. If you're looking across months of history, Grafana doesn't need to drag an absurd number of high-resolution datapoints back just to draw a graph.
The goal is pretty simple: keep queries useful without making every dashboard request unnecessarily expensive.
Now Add Heroku to the Mix
A large Heroku environment can generate a huge metric tree, and Hosted Graphite automatically collects metrics from:
- Heroku dynos metrics (mem/cpu)
- Heroku traffic metrics (methods, statuses, connection timings)
- Heroku Add-ons (Postgres, Redis, Kafka)
- Heroku Processes (worker, scheduler, release, run)
- Herokuconnect (operations, sync timings)
You can also send your own application metrics and external infrastructure metrics into the same account. That means an enterprise Heroku application might have metrics describing infrastructure performance alongside metrics like:
checkout.requests
checkout.errors
queue.depth
jobs.processed
notifications.failed
Suddenly we're not just asking whether the dynos are healthy. We can see whether the application is actually doing what it's supposed to do:
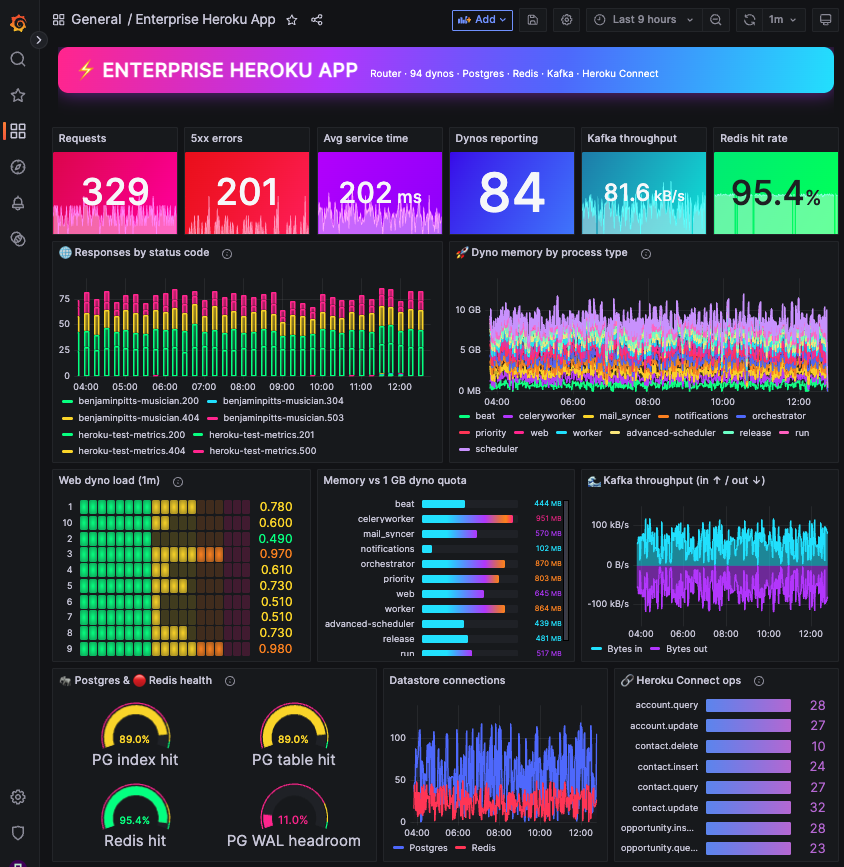
To get started with the Heroku Hosted Graphite Monitoring Add-on, simply run the following commands from within your Heroku CLI:
- heroku addons:create hostedgraphite -a <app-name>
- heroku addons:open hostedgraphite -a <app-name>
Managing Heroku Metric Cardinality
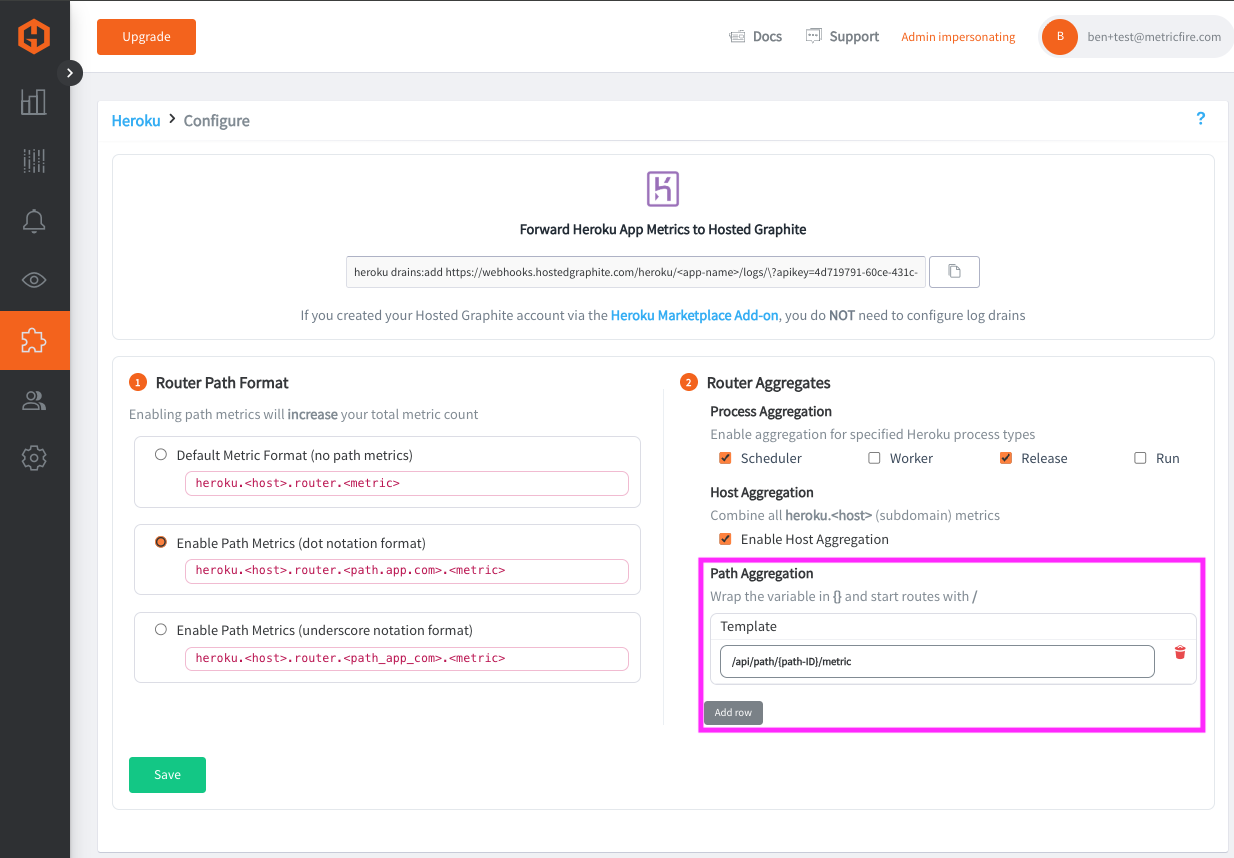
Collecting more metrics isn't always better and this becomes especially obvious with Hosted Graphite's Heroku Router Path Metrics. Path Metrics let Hosted Graphite break router activity down by individual application routes. Instead of only knowing that your application is returning 500s, you can see that they're coming from something like:
/api/checkout
That's useful for enterprise-level apps, but what happens if your routes look like this?
/api/customer/12345/api/customer/67890/api/customer/24680
If every customer ID becomes a unique metric namespace, you've just built yourself a metric-cardinality machine. Hosted Graphite's Path Router Aggregates are designed to handle this. Dynamic portions of paths can be grouped so that thousands of unique URLs can become a useful aggregate such as:
/api/customer/{customer-id}
You still get the signal you actually care about without storing a separate set of router metrics for every customer ID your application has ever seen. Similar aggregation options can be used for changing process identifiers and hostnames because scaling monitoring isn't about blindly collecting everything you possibly can. Sometimes it's about knowing what not to turn into another 50,000 metrics.
Monitoring Multiple Heroku Apps
Enterprise Heroku environments usually don't consist of one application either. You might have separate production services, internal apps, workers, APIs, staging/dev environments, or applications owned by different teams. A dedicated Hosted Graphite account can collect metrics from multiple Heroku applications alongside custom metrics and infrastructure outside Heroku. This makes it possible to build dashboards around the service rather than around wherever that service happens to be running. For example, one dashboard could contain:
- Heroku router performance
- Dyno memory and load
- Postgres/Redis performance
- Custom application metrics
- AWS/Azure/GCP/DigitalOcean infrastructure metrics
When something breaks, you don't particularly care which vendor technically owns each graph. You just want to see what changed.
Even Salesforce Uses Hosted Graphite for their Internal Monitoring
There's a pretty good example of this kind of scale hiding in plain sight. Salesforce itself uses the Hosted Graphite Heroku integration!
Their Hosted Graphite environment stores hundreds of thousands of Heroku and custom application metrics, giving their teams a central place to query, visualize, and alert on a very large metric footprint. At that scale, getting a datapoint into Graphite isn't really the difficult part. The challenge is continuously ingesting the data, storing and aggregating it efficiently, and still being able to throw large Grafana queries at the backend without your monitoring stack becoming the thing you have to monitor.
That's exactly the kind of workload Hosted Graphite was designed around.
Alerting at Enterprise Scale
More metrics can also mean more alerts, which isn't necessarily a good thing. If you've got hundreds of processes and thousands of metrics, creating an alert for every individual signal is a pretty good way to make sure your team eventually ignores all of them.
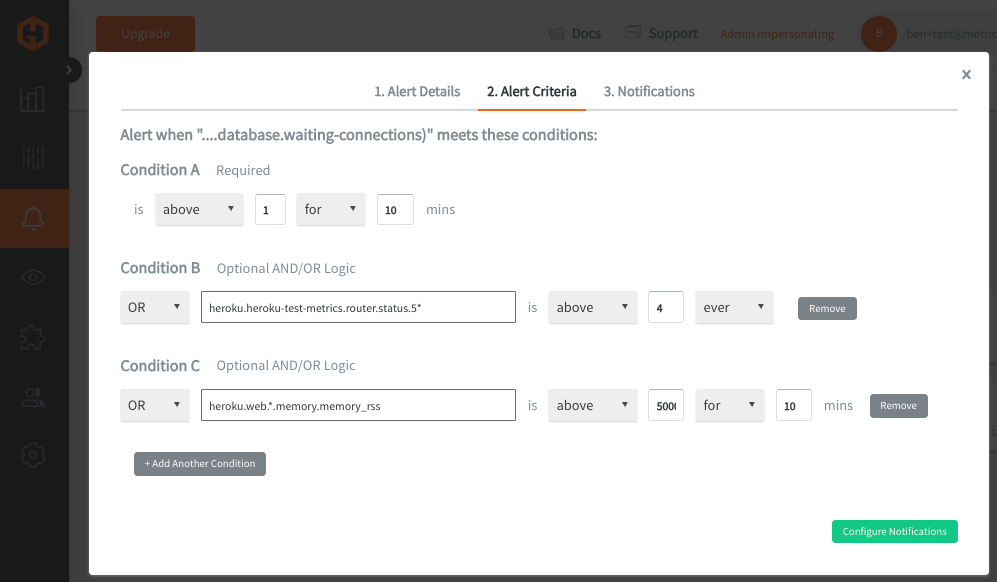
Hosted Graphite Composite Alerts allow you to create service-level alerts for up to 4 wildcard-grouped queries, using AND / OR conditional logic. This way you can monitor groups of related metrics and require multiple conditions to resolve to TRUE before receiving a notification. For example, instead of alerting because one web dyno briefly used more memory than usual, you might alert when:
high Postgres waiting-connections
OR
increased router.status.500
OR
high web dyno memory
Now the alert represents a larger service-level problem instead of one metric having a bad day:
Let Somebody Else Run Graphite
There's nothing wrong with self-hosting Graphite and Grafana and for smaller environments, it can be a great monitoring stack. The question is whether running that stack is actually what your engineering team wants to spend time doing.
Once you're storing hundreds of thousands (or millions) of metrics, keeping ingestion healthy, tuning expensive queries, managing aggregation and retention, maintaining storage, handling backups, and keeping Grafana responsive becomes a it's own job.
Heroku became popular partly because developers could deploy and scale applications without building an entire platform underneath them and we think monitoring should work the same way.
Hosted Graphite handles the Graphite and Grafana infrastructure while your team keeps working on the application. Reach out to us today at support@hostedgraphite.com to speak with our team and learn how to monitor your enterprise-level environment today. We can even build a dedicated cluster for you, with custom Graphite parameters that match your exact use case!


.png)

.svg)