
Free Heroku Monitoring
Let's get one thing out of the way first: nothing on Heroku is really "free" anymore. Heroku's built-in Application Metrics aren't available on Eco dynos. You'll need to be running at least a Basic dyno to get them (at a 24hr resolution), with additional features/resolutions available on Standard or Professional dyno tiers.
But if you're already paying for a Basic or Standard dyno to run your application, you do get some useful monitoring along with it. So for the purposes of this article, we'll call that our "free" starting point. Heroku Application Metrics can show you things like response times, throughput, memory usage, CPU/load, and application events without installing another monitoring service.
For a small app, that might be all you need because maybe you just want to know whether an app is responding normally or whether a dyno suddenly started chewing through memory, Heroku's Metrics tab is a perfectly reasonable place to start.
But there's also a point where checking a few built-in graphs after something breaks isn't really enough. Once an application matters to actual users, its better to have monitoring that tells you something is going wrong before one of your users does.
That's where dedicated monitoring tools like the Heroku Hosted Graphite Monitoring Add-on starts to make more sense.
What Monitoring Comes With Heroku?
Heroku provides Application Metrics directly from the Heroku Dashboard, but you'll need to be running Basic dynos or higher to get them because Eco dynos don't include them. For web dynos, Heroku tracks HTTP metrics including:
- Median response time
- 95th percentile response time
- 99th percentile response time
- Maximum response time
- Request throughput
- HTTP status code groups
Heroku also provides resource metrics across your dynos, including memory usage and CPU/load and that's enough to answer some pretty useful questions.
Did response time suddenly jump? Are 5XX responses increasing? Is a dyno getting close to its memory quota? Did something change around the time of a deployment or restart?
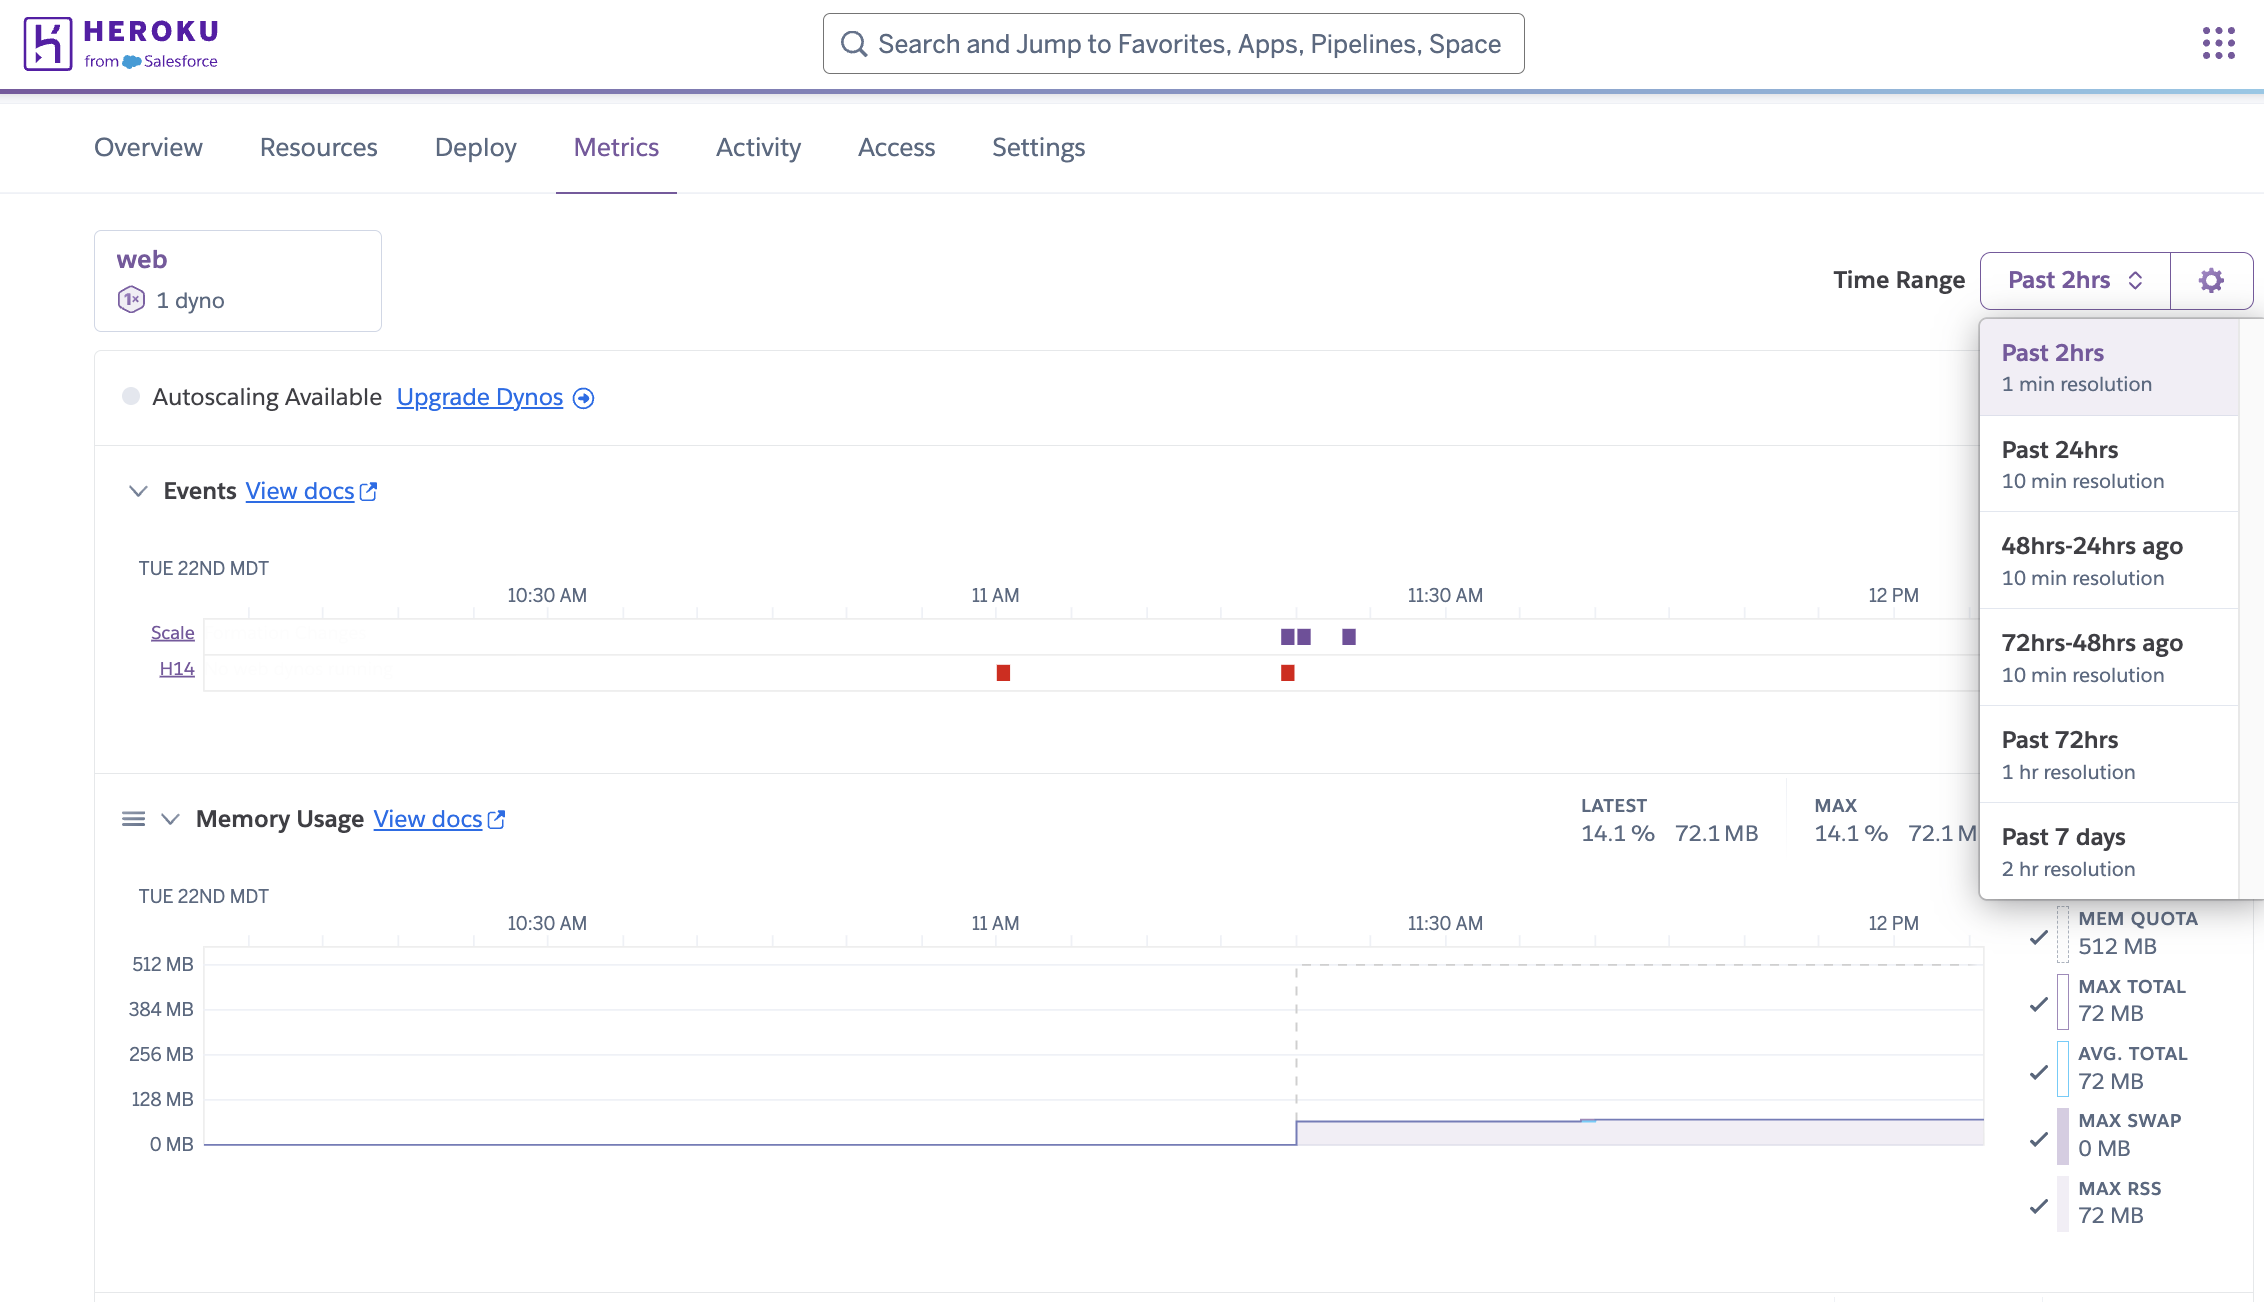
Heroku's Metrics tab is certainly useful for this kind of quick check, but there are some differences depending on which dynos you're paying for. Basic dynos ($7/mo) will report 24 hours of metric history at a 10min resolution, while the Standard Dyno ($25/mo) tier provides finer resolution (60s) and views from 2hrs to 7d:
Affordable Heroku Monitoring with Hosted Graphite
Free monitoring options can be a great place to start, but as your application grows, you may need more visibility into application and infrastructure performance. The Hosted Graphite Heroku add-on starts at only $19/month and provides hosted Graphite and Grafana, customizable dashboards and alerting, with automatic monitoring for Heroku Dynos, Postgres, Redis, Kafka, Heroku Connect, and more.
There are other affordable options in the Heroku ecosystem depending on what you need. SolarWinds Papertrail specializes in centralized log management, while Pingdom focuses primarily on uptime and real-user monitoring. These can be solid choices when your monitoring needs are focused specifically on logs or availability.
But for teams looking for broader metrics-based monitoring, Hosted Graphite provides a ton of functionality at a relatively low starting price. You can monitor your Heroku services alongside custom application metrics, build Grafana dashboards, and configure meaningful alerts all from one platform, making it an affordable next step when free monitoring no longer provides enough visibility.
When Heroku's Built-In Monitoring Isn't Enough
Not every Heroku app needs a full monitoring stack and if you're already running Basic dynos, you're already paying for access to Heroku Application Metrics - so you might as well use them. For a side project, internal tool, or relatively simple application, that's completely fine. You can open the Metrics tab, check response times and memory, look for obvious errors, and move on with your day.
But the strategy changes once an app becomes important. If customers depend on your app, your team needs to support it, or downtime means you're losing money. If you're serious about your app, you should be serious about your monitoring too. For only $19/mo, the Heroku Hosted Graphite Add-on pulls data from your app log stream and stores every event as Graphite metrics that you can use to create custom dashboards and alerts.
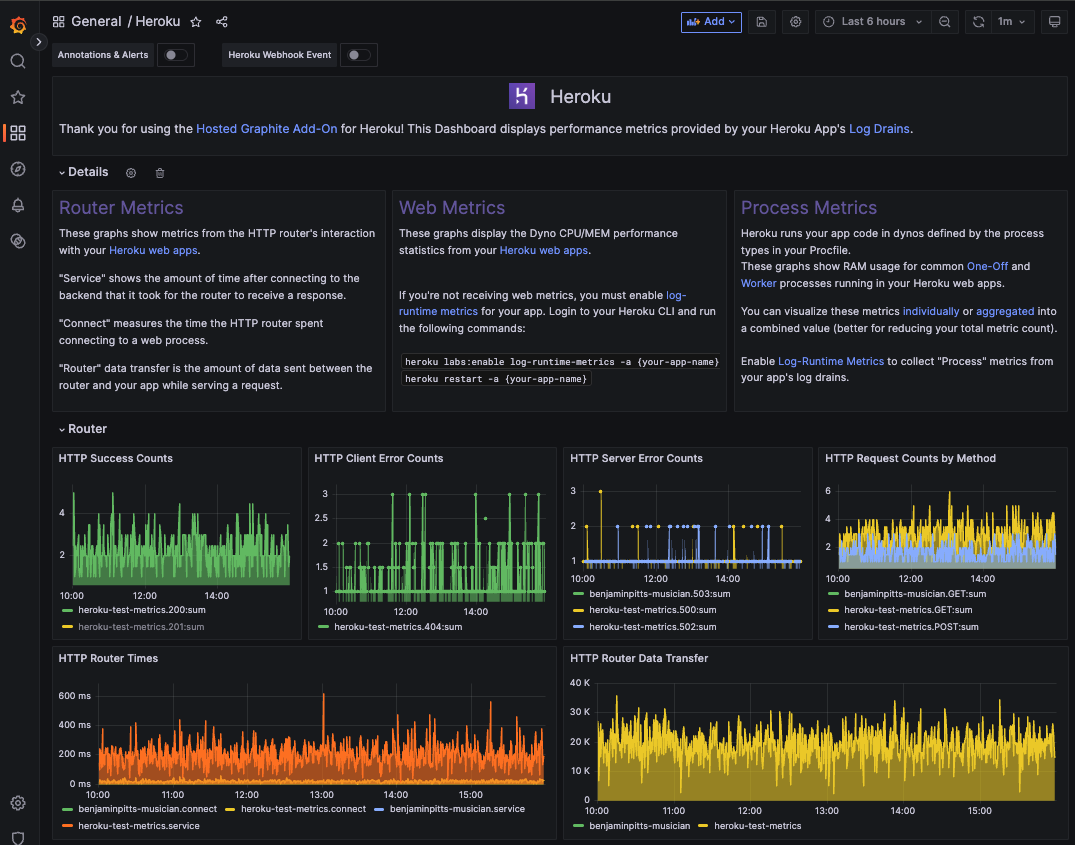
The HG Add-on provides you with dyno metrics (mem/cpu), router metrics (status/method/service timings), process metrics (worker/scheduler/release/run), add-on metrics (Postgres, Redis, Kafka), and Herokuconnect metrics (operations/sync timings). Additionally, you have the option to monitor multiple Heroku apps from within a single account, as well as forward metrics from other parts of your stack, including AWS, Azure, GCP, and DigitalOcean. To get started, simply run the following commands from within your Heroku CLI:
- heroku addons:create hostedgraphite -a <app-name>
- heroku addons:open hostedgraphite -a <app-name>
Once the add-on is attached to your Heroku app, metrics will flow into automatically created Grafana dashboards:
Use HG to See What’s Happening on Individual Routes
Heroku’s built-in metrics view gives you a decent overview of activity across your app, but sometimes you need to know which route is actually causing the trouble. Hosted Graphite’s Path Metrics feature breaks router activity out by individual paths in your application. Once enabled, you can graph things like connection times, request methods, and HTTP status codes for specific routes instead of only looking at app-wide totals.
So if /checkout starts returning 500s or /api/search suddenly gets slow, you can see that activity separately in Grafana, and alert on that specific route without the rest of your application muddying the signal. Path Metrics can use either dot notation or underscore formatting, depending on how you want to manage metric cardinality:
heroku.<appname>.<host>.router.<path(url.com.sub-path)>.<rest_of_metric>
or:
heroku.<appname>.<host>.router.<path(url_com_sub-path)>.<rest_of_metric>
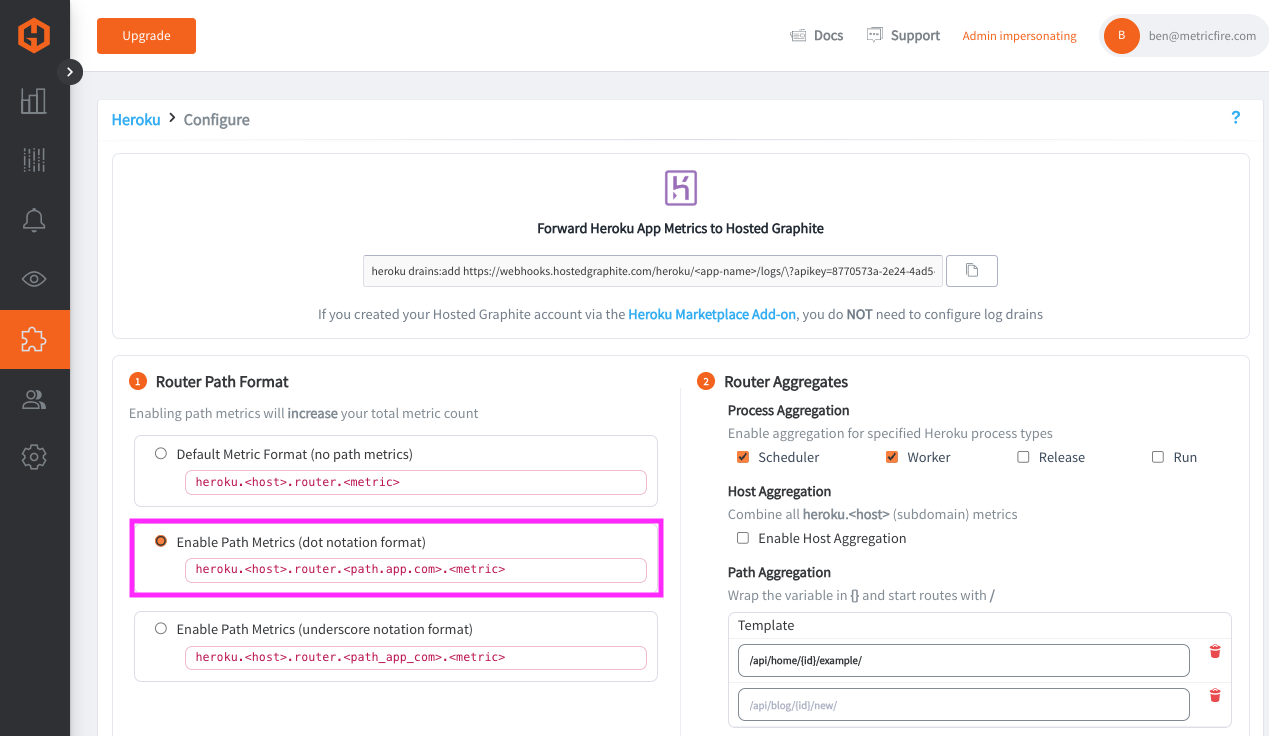
Enabling Path Metrics does mean storing more total metrics in your HG account but for a larger app with many routes, the extra detail can make troubleshooting a whole lot faster.
Conclusion
So, is Heroku monitoring actually free? Not really. But if you’re already paying for a Basic, Standard, or Professional dynos, Heroku gives you some useful metrics to get started with and there’s no reason not to use them.
Once your app becomes important enough that you need longer history, better dashboards, route-level visibility, and alerts that actually tell you when something is going sideways, spending a few bucks on proper monitoring starts making a lot more sense.
Nothing in this crumbling world is truly free, but at least your monitoring bill can be cheaper than finding out your app is broken from an angry customer. Reach out to us today at support@hostedgraphite.com to speak with our knowledgeable team and learn more about configuring robust monitoring for your entire infrastructure.


.png)

.svg)